| Standard Report | Premium Report | |
|---|---|---|
| Current State of the Industry |  |
 |
| Market Size (industry trends) |  |
 |
| Market Forecast (5-year projection) |  |
|
| Products/Services Breakdown |  |
|
| Revenue per State |  |
 |
| Financial Metrics |  |
 |
| Salary & Compensation Statistics |  |
 |
| Public Company Information |  |
 |
| Key Private Companies |  |
|
| Government Vendors |  |
|
| Instant Download - Available immediately upon purchase |  |
 |
Download both PDF and Excel


|
 |
 |
| Download now: |


2026 U.S. Industry Statistics & Market Forecast - Lessors of Nonresidential Buildings
Market Size & Industry Statistics
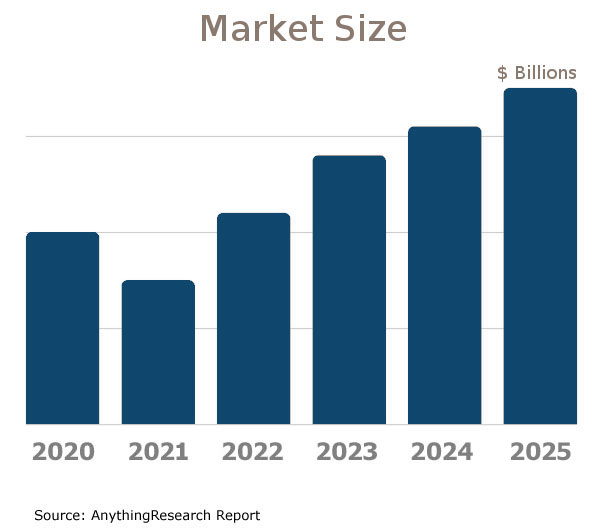
The total U.S. industry market size for Lessors of Nonresidential Buildings :
Industry statistics cover all companies in the United States, both public and private, ranging in size from small businesses to market leaders.
In addition to revenue, the industry market analysis shows information on employees, companies, and average firm size.
Investors, banks, and business executives use growth rates and industry trends to understand the market outlook and opportunity.

| Statistics | 2020 2021 2022 2023 2024 2025 | |
|---|---|---|
| Market Size (Total Sales/Revenue) |
Order at top of page | |
| Total Firms | ||
| Total Employees | ||
| Average Revenue Per Firm | ||
| Average Employees Per Firm | ||
| Average Revenue Per Employee | ||
Market Forecast
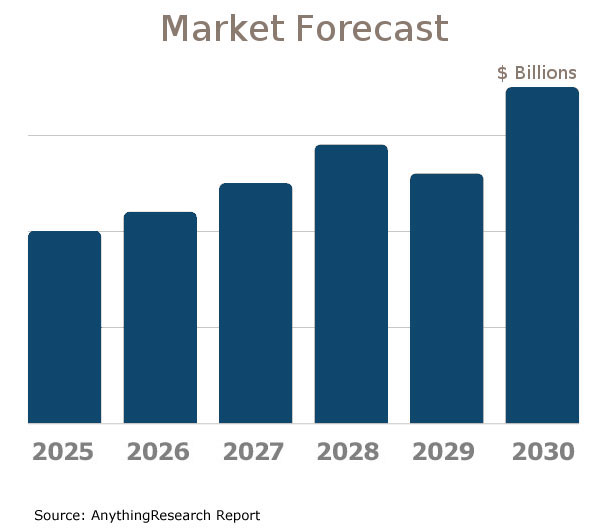
Market forecasts show the long term industry outlook and future growth trends. The following extended five-year forecast projects both short-term and long-term trends.

| Forecast / Industry Outlook | 2025 | 2026 | 2027 | 2028 | 2029 | 2030 |
|---|---|---|---|---|---|---|
| Market Forecast ($ millions) | ||||||
| Projected Industry Growth Rate (%) | ||||||
Industry Insights
Major trends affect the Lessors of Nonresidential Buildings industry include:- Increasing demand for flexible workspace solutions
- Shift towards eco-friendly and sustainable building practices
- Technological integration in building management systems
- Rise in remote working influencing space requirements
- Growing preference for buildings with health and wellness features
- Increase in real estate investment trusts (REITs) participation
- Heightened emphasis on building security and safety features
- Impact of urbanization on demand for prime locations
- Fluctuations in commercial real estate prices impacting lease rates
- Adoption of smart building technologies
- Challenges from e-commerce impacting traditional office setups
- Regulatory changes affecting building standards and lease structures
- Covid-19 pandemic long-term effects on workspace design and utilization
- Expansion in mixed-use developments combining residential, retail, and office spaces
- Rising tenant expectations for high-quality amenities and services
Product & Services Breakdown
Research products and services in the Lessors of Nonresidential Buildings industry generating sales. Note that products are broken into categories with different levels of classification.| Product Description | Number of Companies | Sales ($ millions) | Percent of Total Sales |
|---|---|---|---|
Industry Total |
|||
Interest Income |
|||
Net Gains (Losses) From Sales Of Real Estate Property Owned By This Establishment For Investment, Rent, Or Lease |
|||
Other Investment Income - Net |
|||
Rental Of Residential Space In Buildings Or Other Facilities For Principal Use |
|||
Rental Of Residential Space In Houses For Principal Use |
|||
Rental Of Residential Space In Apartments For Principal Use |
|||
Rental Of Land For Non-Residential Use |
|||
Rental Of Office And Professional Space |
|||
Rental Of Commercial Space |
|||
Rental Of Retail Space In Shopping Malls |
|||
Rental Of Food Service Space In Shopping Malls |
|||
Rental Of Retail Space In Free-Standing Locations |
|||
Rental Of Food Service Space In Free-Standing Locations |
|||
Rental Of Other Commercial Space |
|||
Rental Of Industrial And Manufacturing Space |
|||
Rental Of Space In Industrial Parks |
|||
Rental Of Industrial Space, Except In Industrial Parks |
|||
Rental Of Space For Meetings, Conventions, And Similar Short-Term Business Uses |
|||
Rental Of Space For Weddings, Banquets, Parties And Similar Short-Term Social Uses |
|||
Rental Of Space For Sporting, Entertainment And Other Events |
|||
Rental Of Nonresidential Space In Buildings Or Other Facilities, Not Elsewhere Specified |
|||
Real Estate Agent And Brokerage Services |
|||
Property Management Services |
|||
Nonresidential Building Property Management |
|||
Construction Services |
|||
Other Services |
|||
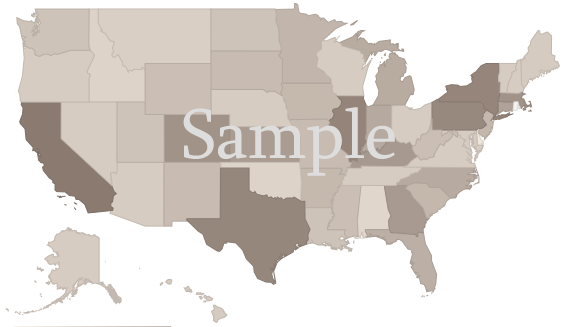
U.S. Geographic Distribution: Revenue Statistics by State
Market Size by State ($ millions) indicates how the industry's competition is distributed throughout the country. State-level information can identify areas with higher and lower industry market share than average.
Income Statement (Average Financial Metrics)
Financial metrics provide a snapshot view of a benchmark "average" company. Key business metrics show revenue and operating costs. The data collected covers both public and private companies.| Industry Average | Percent of Sales (Industry Benchmark) |
|
|---|---|---|
| Total Revenue | Order at top of page |
|
| Operating Revenue | ||
| Cost of Goods Sold | ||
| Gross Profit | ||
Operating Expenses | ||
| Pension, profit sharing plans, stock, annuity | ||
| Repairs | ||
| Rent paid on business property | ||
| Charitable Contributions | ||
| Depletion | ||
| Domestic production activities deduction | ||
| Advertising | ||
| Compensation of officers | ||
| Salaries and wages | ||
| Employee benefit programs | ||
| Taxes and Licenses | ||
| Bad Debts | ||
| Depreciation | ||
| Amortization | ||
| Other Operating Expenses | ||
| Total Operating Expenses | ||
| Operating Income | ||
| Non-Operating Income | ||
| EBIT (Earnings Before Interest and Taxes) | ||
| Interest Expense | ||
| Earnings Before Taxes | ||
| Income Tax | ||
| Net Profit Net Income | ||
Financial Ratio Analysis
Financial ratio information can be used to benchmark how a Lessors of Nonresidential Buildings company compares to its peers. Accounting statistics are calculated from the industry-average for income statements and balance sheets.| Profitability & Valuation Ratios | Industry Average |
|---|---|
| Company valuation can be measured based on the firm's own performance, as well as in comparison against its industry competitors. These metrics show how the average company in the Lessors of Nonresidential Buildings industry is performing. | |
| Profit Margin Gross Profit Margin, Operating Profit Margin, and Net Profit Margin. Show company earnings relative to revenues. |
|
| Return on Equity (ROE) Return on Equity (ROE) is net income as a percentage of shareholders' equity. Shareholders' Equity is defined as the company's total assets minus total liabilities. ROE shows how much profits a company generates with the money shareholders invested (or with retained earnings). |
|
| Return on Assets (ROA) Return on Assets (ROA) is net income relative to total assets. The market research on Lessors of Nonresidential Buildings measures how efficiently the company leverages its assets to generate profit. ROA is calculated as Net Income divided by Total Assets. |
|
| Liquidity Ratios | Industry Average |
|---|---|
| Bankers and suppliers use liquidity to determine creditworthiness and identify potential threats to a company's financial viability. | |
| Current Ratio Measures a firm's ability to pay its debts over the next 12 months. |
|
| Quick Ratio (Acid Test) Calculates liquid assets relative to liabilities, excluding inventories. |
|
| Efficiency Ratios - Key Performance Indicators | Industry Average |
|---|---|
| Measure how quickly products and services sell, and effectively collections policies are implemented. | |
| Receivables Turnover Ratio If this number is low in your business when compared to the industry average in the research report, it may mean your payment terms are too lenient or that you are not doing a good enough job on collections. |
|
| Average Collection Period Based on the Receivables Turnover, this estimates the collection period in days. Calculated as 365 divided by the Receivables Turnover |
|
| Inventory Turnover A low turnover rate may point to overstocking, obsolescence, or deficiencies in the product line or marketing effort. |
|
| Fixed-Asset Turnover Generally, higher is better, since it indicates the business has less money tied up in fixed assets for each dollar of sales revenue. |
|
Compensation & Salary Surveys for Employees
Compensation statistics provides an accurate assessment of industry-specific jobs and national salary averages. This information can be used to identify which positions are most common, and high, low, and average annual wages.| Title | Percent of Workforce | Bottom Quartile | Average (Median) Salary | Upper Quartile |
|---|---|---|---|---|
| Management Occupations | 19% | Order at top of page |
||
| Chief Executives | 0% | |||
| General and Operations Managers | 4% | |||
| Other Management Occupations | 13% | |||
| Property, Real Estate, and Community Association Managers | 12% | |||
| Property, Real Estate, and Community Association Managers | 12% | |||
| Business and Financial Operations Occupations | 8% | |||
| Building and Grounds Cleaning and Maintenance Occupations | 7% | |||
| Building Cleaning and Pest Control Workers | 5% | |||
| Building Cleaning Workers | 5% | |||
| Sales and Related Occupations | 18% | |||
| Retail Sales Workers | 6% | |||
| Counter and Rental Clerks and Parts Salespersons | 5% | |||
| Counter and Rental Clerks | 5% | |||
| Other Sales and Related Workers | 12% | |||
| Real Estate Brokers and Sales Agents | 12% | |||
| Real Estate Sales Agents | 9% | |||
| Office and Administrative Support Occupations | 19% | |||
| Other Office and Administrative Support Workers | 6% | |||
| Office Clerks, General | 6% | |||
| Office Clerks, General | 6% | |||
| Installation, Maintenance, and Repair Occupations | 20% | |||
| Other Installation, Maintenance, and Repair Occupations | 18% | |||
| Maintenance and Repair Workers, General | 17% | |||
| Maintenance and Repair Workers, General | 17% | |||
Lessors of Nonresidential Buildings Competitor Landscape & Key Companies [PREMIUM]
The most influential companies in the Lessors of Nonresidential Buildings industry and adjacent industries either have large market share or are developing new business models and methods that could disrupt the status quo. We look at leading and emerging companies in the Lessors of Nonresidential Buildings industry and adjacent sectors:| Market Leaders: Direct Competitors Companies with the largest market share, focused in this industry |
Market leaders: Diversified Competitors Largest companies that have diversified operations in this and other industries |
| Innovators: Direct Competitors Innovative, Emerging, and Disruptive Companies that may influence the future direction of the industry. |
Innovators: Diversified Competitors Innovators and Disruptors in adjacent industries that may also affect the Lessors of Nonresidential Buildings industry. |
Latest Industry News
- No tall buildings can now come up around Ram temple in Ayodhya - Ayodhya: Under ‘Master Plan 2031', the Ayodhya Development Authority has declared areas around the Ram temple as restricted zones and barred the construction of tall buildings around it. (06/14/2025)
- State of fatherhood | Northwest Arkansas Democrat-Gazette - There's only one mention of "respect," in the context of treatment nonresidential dads receive from others. "Duty" has two abstract mentions, in the same sentence repeated in two sections, ... (06/13/2025)
- Immigrants at ICE check-ins detained, held in basement of federal building in Los Angeles, some overnight - CBS News - Many undocumented immigrants who went to ICE check-in appointments at a federal building in L.A. this week were taken into custody, brought to the basement and held there, lawyers and family ... (06/07/2025)
- 4-alarm fire rips through multiple buildings in San Francisco - Forward progress of the flames was stopped at about 4:30 a.m., but the fire remained active on the inside of some of the buildings, fire officials said. More than 130 firefighters responded to the ... (06/06/2025)
- Buildings in Palestine, Senegal and Iran on Aga Khan shortlist - Dezeen - The Aga Khan Award for Architecture has announced the 19-strong shortlist including buildings by Marina Tabassum, Kéré Architecture and David Chipperfield Architects. (06/05/2025)
- WS Unveils Renderings Of New Building Behind Fenway’s Green Monster - The building is the first phase of the 2M SF Fenway Corners development, planned to span eight buildings around Fenway Park. The BPDA approved the overall plans for the development in July 2023. (06/04/2025)
- Why Louisville is increasing demolitions of unsafe buildings - Courier-Journal - Occupied buildings that face demolition, like Schiller Terrace, are often affordable to low-income residents. And the decision to get rid of them can be difficult, especially as Louisville faces a ... (06/03/2025)
- Dubai plane lessor DAE secures $300 million unsecured term loan - Gulf News - Dubai: Dubai-based plane lessor Dubai Aerospace Enterprise (DAE) announced Monday it has secured a $300 million three-year unsecured term loan with Bank of China’s Dubai Bank of China Limited ... (06/02/2025)
- 3i Seeks Pitches for Sale of Airport Services Firm TCR - 3i Infrastructure Plc has asked for bank pitches as it prepares for a sale of airport ground support equipment company TCR, according to people familiar with the matter. (05/30/2025)
- In a city burdened by health hazards of lead, they’re trying to repair school buildings and public trust - After a child was found to have lead poisoning from peeling lead paint in a local elementary school early this year, the district began closing buildings and temporarily relocating students. (05/09/2025)


