| Standard Report | Premium Report | |
|---|---|---|
| Current State of the Industry |  |
 |
| Market Size (industry trends) |  |
 |
| Market Forecast (5-year projection) |  |
|
| Products/Services Breakdown |  |
|
| Revenue per State |  |
 |
| Financial Metrics |  |
 |
| Salary & Compensation Statistics |  |
 |
| Public Company Information |  |
 |
| Key Private Companies |  |
|
| Government Vendors |  |
|
| Instant Download - Available immediately upon purchase |  |
 |
Download both PDF and Excel


|
 |
 |
| Download now: |


2026 U.S. Industry Statistics & Market Forecast - Private Equity and Portfolio Management
Market Size & Industry Statistics
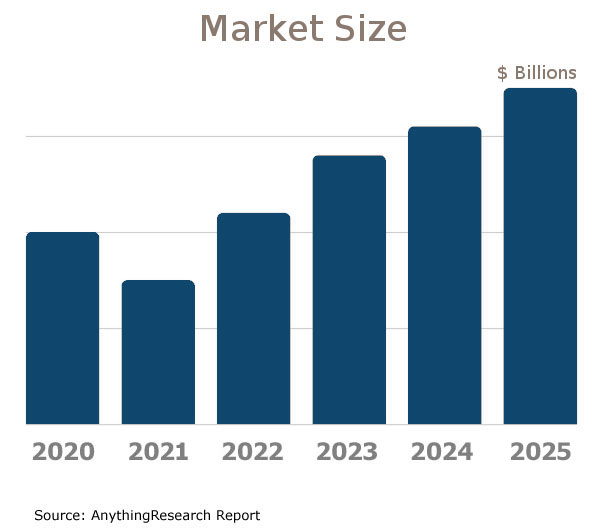
The total U.S. industry market size for Private Equity and Portfolio Management:
Industry statistics cover all companies in the United States, both public and private, ranging in size from small businesses to market leaders.
In addition to revenue, the industry market analysis shows information on employees, companies, and average firm size.
Investors, banks, and business executives use growth rates and industry trends to understand the market outlook and opportunity.

| Statistics | 2020 2021 2022 2023 2024 2025 | |
|---|---|---|
| Market Size (Total Sales/Revenue) |
Order at top of page | |
| Total Firms | ||
| Total Employees | ||
| Average Revenue Per Firm | ||
| Average Employees Per Firm | ||
| Average Revenue Per Employee | ||
Market Forecast
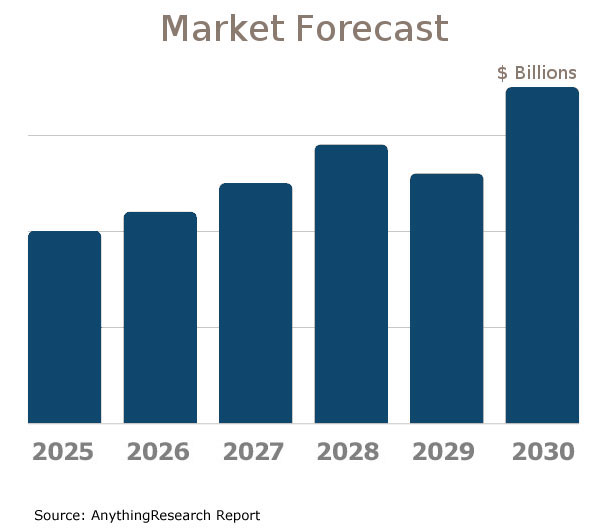
Market forecasts show the long term industry outlook and future growth trends. The following extended five-year forecast projects both short-term and long-term trends.

| Forecast / Industry Outlook | 2025 | 2026 | 2027 | 2028 | 2029 | 2030 |
|---|---|---|---|---|---|---|
| Market Forecast ($ millions) | ||||||
| Projected Industry Growth Rate (%) | ||||||
Product & Services Breakdown
Research products and services in the Private Equity and Portfolio Management industry generating sales. Note that products are broken into categories with different levels of classification.| Product Description | Number of Companies | Sales ($ millions) | Percent of Total Sales |
|---|---|---|---|
Industry Total |
|||
Loan Services - Income |
|||
Securities Origination Services |
|||
Brokering And Dealing Services For Debt Instruments |
|||
Commercial Paper Issued By Financial Institutions |
|||
Brokering And Dealing Services For Equities |
|||
Brokering And Dealing Services For Derivative Contracts |
|||
Futures Contracts, Exchange-Traded |
|||
Options Contracts, Exchange-Traded |
|||
Brokering And Dealing Services For Investment Company Securities, Including Mutual Funds, Closed-End Funds, And Unit Investment |
|||
Brokering And Dealing Services For Other Financial Instruments |
|||
Trading Debt Instruments On Own Account - Net Gains (Losses) |
|||
Trading Equities On Own Account - Net Gains (Losses) |
|||
Trading Other Securities And Commodity Contracts On Own Account - Net Gains (Losses) |
|||
Trust Services - Fiduciary Fees |
|||
Trust Services For Businesses And Governments |
|||
Personal Trust Services |
|||
Other Trust Services |
|||
Support Services For Financial And Commodity Markets |
|||
Support Services For Financial Market And Clearing Products, Not Elsewhere Specified |
|||
Financial Planning And Investment Management Services |
|||
Financial Management Consulting Services |
|||
Personal Financial Planning And Advice Services |
|||
Personal Investment Management Services |
|||
Mergers And Acquisition Financial Consulting Services |
|||
Other Products Supporting Financial Services - Fees |
|||
Insurance Brokerage And Agency Services - Commissions |
|||
U.S. Geographic Distribution: Revenue Statistics by State
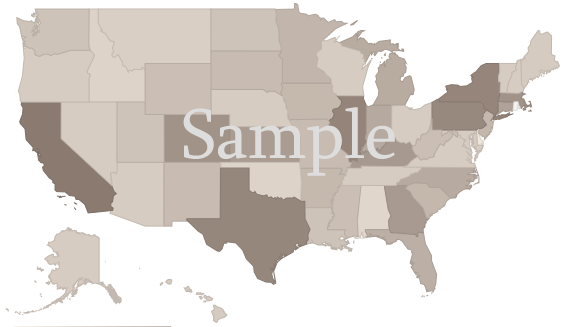
Market Size by State ($ millions) indicates how the industry's competition is distributed throughout the country. State-level information can identify areas with higher and lower industry market share than average.
Income Statement (Average Financial Metrics)
Financial metrics provide a snapshot view of a benchmark "average" company. Key business metrics show revenue and operating costs. The data collected covers both public and private companies.| Industry Average | Percent of Sales (Industry Benchmark) |
|
|---|---|---|
| Total Revenue | Order at top of page |
|
| Operating Revenue | ||
| Cost of Goods Sold | ||
| Gross Profit | ||
Operating Expenses | ||
| Pension, profit sharing plans, stock, annuity | ||
| Repairs | ||
| Rent paid on business property | ||
| Charitable Contributions | ||
| Depletion | ||
| Domestic production activities deduction | ||
| Advertising | ||
| Compensation of officers | ||
| Salaries and wages | ||
| Employee benefit programs | ||
| Taxes and Licenses | ||
| Bad Debts | ||
| Depreciation | ||
| Amortization | ||
| Other Operating Expenses | ||
| Total Operating Expenses | ||
| Operating Income | ||
| Non-Operating Income | ||
| EBIT (Earnings Before Interest and Taxes) | ||
| Interest Expense | ||
| Earnings Before Taxes | ||
| Income Tax | ||
| Net Profit Net Income | ||
Financial Ratio Analysis
Financial ratio information can be used to benchmark how a Private Equity and Portfolio Management company compares to its peers. Accounting statistics are calculated from the industry-average for income statements and balance sheets.| Profitability & Valuation Ratios | Industry Average |
|---|---|
| Company valuation can be measured based on the firm's own performance, as well as in comparison against its industry competitors. These metrics show how the average company in the Private Equity and Portfolio Management industry is performing. | |
| Profit Margin Gross Profit Margin, Operating Profit Margin, and Net Profit Margin. Show company earnings relative to revenues. |
|
| Return on Equity (ROE) Return on Equity (ROE) is net income as a percentage of shareholders' equity. Shareholders' Equity is defined as the company's total assets minus total liabilities. ROE shows how much profits a company generates with the money shareholders invested (or with retained earnings). |
|
| Return on Assets (ROA) Return on Assets (ROA) is net income relative to total assets. The market research on Private Equity and Portfolio Management measures how efficiently the company leverages its assets to generate profit. ROA is calculated as Net Income divided by Total Assets. |
|
| Liquidity Ratios | Industry Average |
|---|---|
| Bankers and suppliers use liquidity to determine creditworthiness and identify potential threats to a company's financial viability. | |
| Current Ratio Measures a firm's ability to pay its debts over the next 12 months. |
|
| Quick Ratio (Acid Test) Calculates liquid assets relative to liabilities, excluding inventories. |
|
| Efficiency Ratios - Key Performance Indicators | Industry Average |
|---|---|
| Measure how quickly products and services sell, and effectively collections policies are implemented. | |
| Receivables Turnover Ratio If this number is low in your business when compared to the industry average in the research report, it may mean your payment terms are too lenient or that you are not doing a good enough job on collections. |
|
| Average Collection Period Based on the Receivables Turnover, this estimates the collection period in days. Calculated as 365 divided by the Receivables Turnover |
|
| Inventory Turnover A low turnover rate may point to overstocking, obsolescence, or deficiencies in the product line or marketing effort. |
|
| Fixed-Asset Turnover Generally, higher is better, since it indicates the business has less money tied up in fixed assets for each dollar of sales revenue. |
|
Compensation & Salary Surveys for Employees
Compensation statistics provides an accurate assessment of industry-specific jobs and national salary averages. This information can be used to identify which positions are most common, and high, low, and average annual wages.| Title | Percent of Workforce | Bottom Quartile | Average (Median) Salary | Upper Quartile |
|---|---|---|---|---|
| Management Occupations | 14% | Order at top of page |
||
| Chief Executives | 0% | |||
| General and Operations Managers | 4% | |||
| Operations Specialties Managers | 7% | |||
| Financial Managers | 5% | |||
| Financial Managers | 5% | |||
| Business and Financial Operations Occupations | 42% | |||
| Business Operations Specialists | 6% | |||
| Financial Specialists | 35% | |||
| Financial Analysts and Advisors | 29% | |||
| Financial and Investment Analysts | 8% | |||
| Personal Financial Advisors | 20% | |||
| Computer and Mathematical Occupations | 7% | |||
| Computer Occupations | 6% | |||
| Sales and Related Occupations | 17% | |||
| Sales Representatives, Services | 16% | |||
| Securities, Commodities, and Financial Services Sales Agents | 16% | |||
| Securities, Commodities, and Financial Services Sales Agents | 16% | |||
| Office and Administrative Support Occupations | 19% | |||
| Information and Record Clerks | 7% | |||
| Secretaries and Administrative Assistants | 5% | |||
| Secretaries and Administrative Assistants | 5% | |||
Private Equity and Portfolio Management Competitor Landscape & Key Companies [PREMIUM]
The most influential companies in the Private Equity and Portfolio Management industry and adjacent industries either have large market share or are developing new business models and methods that could disrupt the status quo. We look at leading and emerging companies in the Private Equity and Portfolio Management industry and adjacent sectors:| Market Leaders: Direct Competitors Companies with the largest market share, focused in this industry |
Market leaders: Diversified Competitors Largest companies that have diversified operations in this and other industries |
| Innovators: Direct Competitors Innovative, Emerging, and Disruptive Companies that may influence the future direction of the industry. |
Innovators: Diversified Competitors Innovators and Disruptors in adjacent industries that may also affect the Private Equity and Portfolio Management industry. |
Latest Industry News
- How DBS Turns Insight Into Impact For Wealth Clients - DBS turns bold insights into real impact with a disciplined strategy, early AI bets, and exclusive private deals for its wealth clients. (07/07/2025)
- The Indian Wealth Conundrum: High Growth, Low Fees, and Infinite Complexity - “Clients will pay 1% to a wealth manager in Singapore,” observed one senior banker, “but in India, the same client will argue over 25 basis points.” The sentiment was echoed by others: fee undercutting is widespread, and many firms are struggling to sustain cost-income ratios above 60%. (07/07/2025)
- India’s family offices are moving from gut to governance, says Julius Baer’s Ashwin Patni - As private allocations and intergenerational transitions rise, family offices are becoming more structured in their approach to risk, digitisation, and global diversification, says Patni (07/07/2025)
- Early startup backers are looking to exit in a tight market. Specialist funds swoop in - A surge of global and domestic capital is chasing secondary deals as early-stage domestic funds are nearing the end of their lifecycles, pushing them to explore alternative exit routes in a tight funding environment. (07/07/2025)
- Brookfield sells US$690-million in private-equity stakes to set up fund targeting wealthy investors - Plans to launch evergreen fund later this year, building the base for a new strategy to attract high net worth investors (07/03/2025)
- Private equity funds are driving transformation of India’s hospital chains - India’s hospital sector is entering a phase of professionalisation, consolidation, and capital-led transformation. PE funds, with their operational acumen and financial muscle, are emerging as catalys (07/03/2025)
- Leaders of Influence: Private Equity, Investors & Advisors 2025 – Tom Waldman - THOMAS WALDMAN Partner Stradling Tom Waldman has represented private equity funds, business owners and management teams for more than 25 years. In 2018, (07/02/2025)
- Private Equity Gaming Play: AGS Embarks on New Chapter Following Brightstar Capital’s Strategic Acquisition - The gaming industry witnessed another significant private equity move in July 2025 when Brightstar Capital Partners successfully closed its $1.1 billion acquisition of PlayAGS, Inc., transforming the Las Vegas-based gaming supplier from a publicly traded entity into a private company. (07/02/2025)
- When Private Goes Public: Inside The S&P Listed Private Equity Index - The private equity industry has experienced a notable shift with a growing wave of high-profile public listings worldwide. (06/30/2025)
- How Private Equity Killed the American Dream - In her new book “Bad Company,” journalist Megan Greenwell chronicles how private equity upended industries from health care to local news—and the ways workers are fighting back. (06/17/2025)


