
| Standard Report | Premium Report | |
|---|---|---|
| Current State of the Industry |  |
|
| Market Size (industry trends) | |
|
| Market Forecast (5-year projection) | |
|
| Products/Services Breakdown | |
|
| Revenue per State | |
|
| Financial Metrics | |
|
| Salary & Compensation Statistics | |
|
| Public Company Information | |
|
| Key Private Companies | |
|
| Government Vendors | |
|
| Instant Download - Available immediately upon purchase | |
|
| Download both PDF and Excel
|
|
|
| Download now: |


2024 U.S. Industry Statistics & Market Forecast - Beverage and Tobacco Product Manufacturing
Market Size & Industry Statistics
The total U.S. industry market size for Beverage and Tobacco Product Manufacturing:
Industry statistics cover all companies in the United States, both public and private, ranging in size from small businesses to market leaders.
In addition to revenue, the industry market analysis shows information on employees, companies, and average firm size.
Investors, banks, and business executives use growth rates and industry trends to understand the market outlook and opportunity.
| Statistics | 2019 2020 2021 2022 2023 | |
|---|---|---|
| Market Size (Total Sales/Revenue) |
Order at top of page | |
| Total Firms | ||
| Total Employees | ||
| Average Revenue Per Firm | ||
| Average Employees Per Firm | ||
| Average Revenue Per Employee | ||
Market Forecast
Market forecasts show the long term industry outlook and future growth trends. The following extended five-year forecast projects both short-term and long-term trends.
| Forecast / Industry Outlook | 2024 | 2025 | 2026 | 2027 | 2028 |
|---|---|---|---|---|---|
| Market Forecast ($ millions) | |||||
| Projected Industry Growth Rate (%) | |||||
Industry Insights
Major trends affect the Beverage and Tobacco Product Manufacturing industry include:- Increased automation and robotics
- Shift to renewable energy sources
- Rise of remote and flexible work
- Growing importance of AI and machine learning
- Data privacy and cybersecurity challenges
- Expansion of 5G technology
- Sustainable and eco-friendly practices
- Personalization and customization
- Integration of Internet of Things (IoT)
- Heightened global competition
- E-commerce and direct-to-consumer models
- Advancements in blockchain technology
- Regulatory and compliance pressures
- Consumer demand for transparency and ethics
- Impact of climate change on operations
U.S. Geographic Distribution: Revenue Statistics by State
Market Size by State ($ millions) indicates how the industry's competition is distributed throughout the country. State-level information can identify areas with higher and lower industry market share than average.
Beverage and Tobacco Product Manufacturing Industry Price Trends
Rise and fall in market prices are affectedd by supply, demand, and the cost of goods/services sold. Higher demand or COGS will put upward price pressure on prices. Higher competition among Beverage and Tobacco Product Manufacturing companies will put a downward pressure on prices. The chart shows how prices are changing within the industry, month-to-month over the last three years.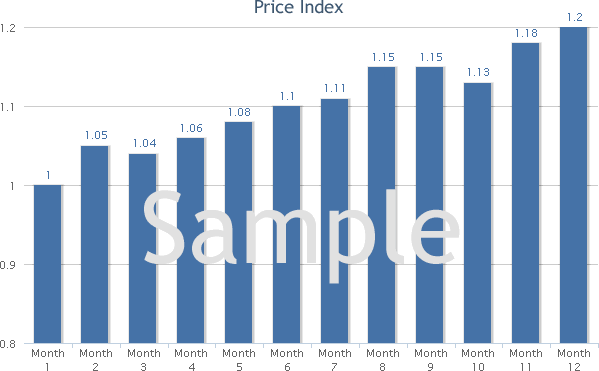
Income Statement (Average Financial Metrics)
Financial metrics provide a snapshot view of a benchmark "average" company. Key business metrics show revenue and operating costs. The data collected covers both public and private companies.| Industry Average | Percent of Sales (Industry Benchmark) |
|
|---|---|---|
| Total Revenue | Order at top of page |
|
| Operating Revenue | ||
| Cost of Goods Sold | ||
| Gross Profit | ||
Operating Expenses | ||
| Pension, profit sharing plans, stock, annuity | ||
| Repairs | ||
| Rent paid on business property | ||
| Charitable Contributions | ||
| Depletion | ||
| Domestic production activities deduction | ||
| Advertising | ||
| Compensation of officers | ||
| Salaries and wages | ||
| Employee benefit programs | ||
| Taxes and Licenses | ||
| Bad Debts | ||
| Depreciation | ||
| Amortization | ||
| Other Operating Expenses | ||
| Total Operating Expenses | ||
| Operating Income | ||
| Non-Operating Income | ||
| EBIT (Earnings Before Interest and Taxes) | ||
| Interest Expense | ||
| Earnings Before Taxes | ||
| Income Tax | ||
| Net Profit Net Income | ||
Financial Ratio Analysis
Financial ratio information can be used to benchmark how a Beverage and Tobacco Product Manufacturing company compares to its peers. Accounting statistics are calculated from the industry-average for income statements and balance sheets.| Profitability & Valuation Ratios | Industry Average |
|---|---|
| Company valuation can be measured based on the firm's own performance, as well as in comparison against its industry competitors. These metrics show how the average company in the Beverage and Tobacco Product Manufacturing industry is performing. | |
| Profit Margin Gross Profit Margin, Operating Profit Margin, and Net Profit Margin. Show company earnings relative to revenues. |
|
| Return on Equity (ROE) Return on Equity (ROE) is net income as a percentage of shareholders' equity. Shareholders' Equity is defined as the company's total assets minus total liabilities. ROE shows how much profits a company generates with the money shareholders invested (or with retained earnings). |
|
| Return on Assets (ROA) Return on Assets (ROA) is net income relative to total assets. The market research on Beverage and Tobacco Product Manufacturing measures how efficiently the company leverages its assets to generate profit. ROA is calculated as Net Income divided by Total Assets. |
|
| Liquidity Ratios | Industry Average |
|---|---|
| Bankers and suppliers use liquidity to determine creditworthiness and identify potential threats to a company's financial viability. | |
| Current Ratio Measures a firm's ability to pay its debts over the next 12 months. |
|
| Quick Ratio (Acid Test) Calculates liquid assets relative to liabilities, excluding inventories. |
|
| Efficiency Ratios - Key Performance Indicators | Industry Average |
|---|---|
| Measure how quickly products and services sell, and effectively collections policies are implemented. | |
| Receivables Turnover Ratio If this number is low in your business when compared to the industry average in the research report, it may mean your payment terms are too lenient or that you are not doing a good enough job on collections. |
|
| Average Collection Period Based on the Receivables Turnover, this estimates the collection period in days. Calculated as 365 divided by the Receivables Turnover |
|
| Inventory Turnover A low turnover rate may point to overstocking, obsolescence, or deficiencies in the product line or marketing effort. |
|
| Fixed-Asset Turnover Generally, higher is better, since it indicates the business has less money tied up in fixed assets for each dollar of sales revenue. |
|
Compensation & Salary Surveys for Employees
Compensation statistics provides an accurate assessment of industry-specific jobs and national salary averages. This information can be used to identify which positions are most common, and high, low, and average annual wages.| Title | Percent of Workforce | Bottom Quartile | Average (Median) Salary | Upper Quartile |
|---|---|---|---|---|
| Management Occupations | 6% | Order at top of page |
||
| Chief Executives | 0% | |||
| General and Operations Managers | 2% | |||
| Food Preparation and Serving Related Occupations | 23% | |||
| Food and Beverage Serving Workers | 16% | |||
| Bartenders | 11% | |||
| Bartenders | 11% | |||
| Waiters and Waitresses | 5% | |||
| Waiters and Waitresses | 5% | |||
| Sales and Related Occupations | 13% | |||
| Office and Administrative Support Occupations | 5% | |||
| Installation, Maintenance, and Repair Occupations | 5% | |||
| Other Installation, Maintenance, and Repair Occupations | 9% | |||
| Industrial Machinery Installation, Repair, and Maintenance Workers | 5% | |||
| Production Occupations | 23% | |||
| Supervisors of Production Workers | 7% | |||
| First-Line Supervisors of Production and Operating Workers | 7% | |||
| First-Line Supervisors of Production and Operating Workers | 7% | |||
| Food Processing Workers | 9% | |||
| Miscellaneous Food Processing Workers | 9% | |||
| Food and Tobacco Roasting, Baking, and Drying Machine Operators and Tenders | 9% | |||
| Other Production Occupations | 18% | |||
| Chemical Processing Machine Setters, Operators, and Tenders | 7% | |||
| Separating, Filtering, Clarifying, Precipitating, and Still Machine Setters, Operators, and Tenders | 7% | |||
| Packaging and Filling Machine Operators and Tenders | 8% | |||
| Packaging and Filling Machine Operators and Tenders | 8% | |||
| Transportation and Material Moving Occupations | 12% | |||
| Material Moving Workers | 8% | |||
| Laborers and Material Movers | 5% | |||
Beverage and Tobacco Product Manufacturing Competitor Landscape & Key Companies [PREMIUM]
The most influential companies in the Beverage and Tobacco Product Manufacturing industry and adjacent industries either have large market share or are developing new business models and methods that could disrupt the status quo. We look at leading and emerging companies in the Beverage and Tobacco Product Manufacturing industry and adjacent sectors:| Market Leaders: Direct Competitors Companies with the largest market share, focused in this industry |
Market leaders: Diversified Competitors Largest companies that have diversified operations in this and other industries |
| Innovators: Direct Competitors Innovative, Emerging, and Disruptive Companies that may influence the future direction of the industry. |
Innovators: Diversified Competitors Innovators and Disruptors in adjacent industries that may also affect the Beverage and Tobacco Product Manufacturing industry. |
Source:

set naics manually https://incfact.com/rss/fedspending-by-naics-total-2023-
https://incfact.com/rss/fedspending-by-naics-total-2024-
Recent Federal Contracts for Beverage and Tobacco Product Manufacturing
- Apr 02, 2024: DAY MANAGEMENT CORP. (Milwaukie, OR) awarded $12,000
- Apr 02, 2024: PEGASUS RADIO CORP (Aberdeen, MD) awarded $53,266
- Apr 02, 2024: BAY AREA ENVIRONMENTAL RESEARCH INSTITUTE (Moffett Field, CA) awarded $117,048,742
- Apr 02, 2024: BIOTEK INSTRUMENTS, INC. (Winooski, VT) awarded $2,575
- Apr 02, 2024: BURBANK DENTAL LABORATORY, INC. (Burbank, CA) awarded $10,774
- Apr 02, 2024: MATTHEWS GROUP INC (Purcellville, VA) awarded $7,505,945


Related Reports
Can't find what you're looking for? We have over a thousand
market research reports.
Ask us and an analyst will help you find what you need.