| Standard Report | Premium Report | |
|---|---|---|
| Current State of the Industry |  |
 |
| Market Size (industry trends) |  |
 |
| Market Forecast (5-year projection) |  |
|
| Products/Services Breakdown |  |
|
| Revenue per State |  |
 |
| Financial Metrics |  |
 |
| Salary & Compensation Statistics |  |
 |
| Public Company Information |  |
 |
| Key Private Companies |  |
|
| Government Vendors |  |
|
| Instant Download - Available immediately upon purchase |  |
 |
Download both PDF and Excel


|
 |
 |
| Download now: |


2026 U.S. Industry Statistics & Market Forecast - Research and Development in the Physical, Engineering, and Life Sciences
Market Size & Industry Statistics
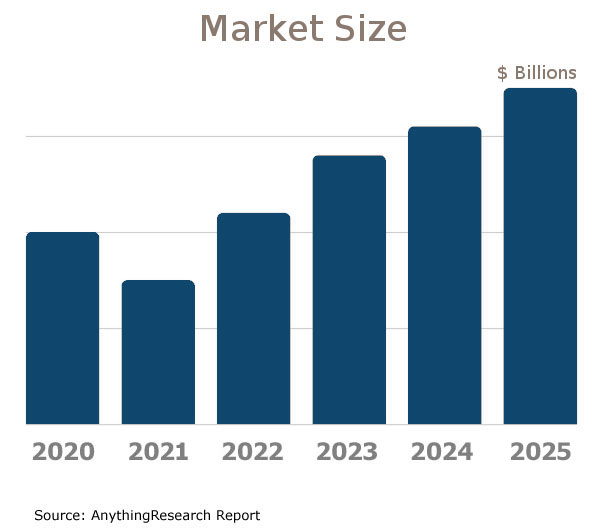
The total U.S. industry market size for Research and Development in the Physical, Engineering, and Life Sciences :
Industry statistics cover all companies in the United States, both public and private, ranging in size from small businesses to market leaders.
In addition to revenue, the industry market analysis shows information on employees, companies, and average firm size.
Investors, banks, and business executives use growth rates and industry trends to understand the market outlook and opportunity.

| Statistics | 2020 2021 2022 2023 2024 2025 | |
|---|---|---|
| Market Size (Total Sales/Revenue) |
Order at top of page | |
| Total Firms | ||
| Total Employees | ||
| Average Revenue Per Firm | ||
| Average Employees Per Firm | ||
| Average Revenue Per Employee | ||
Market Forecast
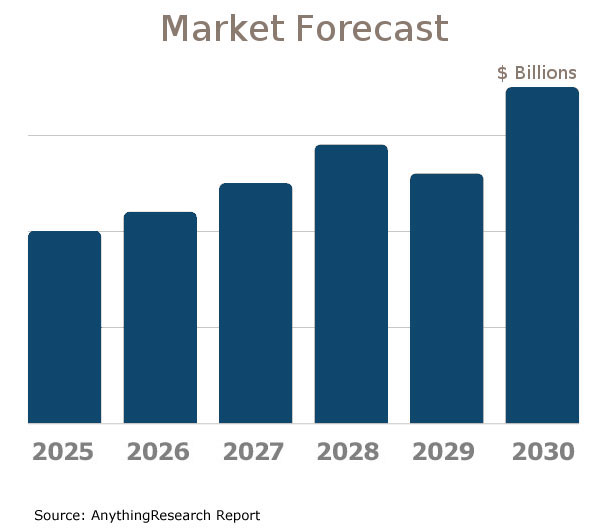
Market forecasts show the long term industry outlook and future growth trends. The following extended five-year forecast projects both short-term and long-term trends.

| Forecast / Industry Outlook | 2025 | 2026 | 2027 | 2028 | 2029 | 2030 |
|---|---|---|---|---|---|---|
| Market Forecast ($ millions) | ||||||
| Projected Industry Growth Rate (%) | ||||||
Industry Insights
Major trends affect the Research and Development in the Physical, Engineering, and Life Sciences industry include:- Increasing emphasis on sustainability and green technologies
- Growing integration of AI and machine learning
- Expansion in biotechnology and genomic research
- Rise of personalized medicine
- Enhanced focus on cybersecurity for connected devices
- Shift towards virtual and remote laboratory environments
- Increased importance of data analytics and big data
- Collaborations and partnerships between academia and industry
- Scaling up of automation and robotic processes
- Emphasis on innovation in materials science for better performance and reduced environmental impact
- Rapid prototyping and advancements in 3D printing
- Greater regulatory scrutiny and compliance requirements
U.S. Geographic Distribution: Revenue Statistics by State
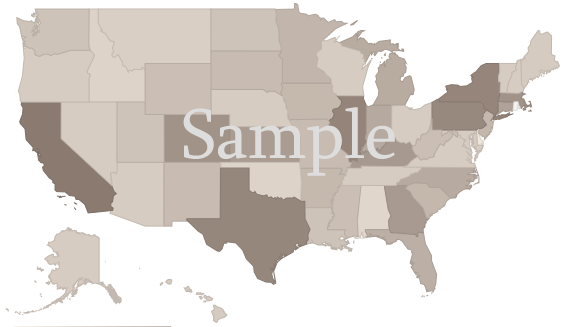
Market Size by State ($ millions) indicates how the industry's competition is distributed throughout the country. State-level information can identify areas with higher and lower industry market share than average.
Income Statement (Average Financial Metrics)
Financial metrics provide a snapshot view of a benchmark "average" company. Key business metrics show revenue and operating costs. The data collected covers both public and private companies.| Industry Average | Percent of Sales (Industry Benchmark) |
|
|---|---|---|
| Total Revenue | Order at top of page |
|
| Operating Revenue | ||
| Cost of Goods Sold | ||
| Gross Profit | ||
Operating Expenses | ||
| Pension, profit sharing plans, stock, annuity | ||
| Repairs | ||
| Rent paid on business property | ||
| Charitable Contributions | ||
| Depletion | ||
| Domestic production activities deduction | ||
| Advertising | ||
| Compensation of officers | ||
| Salaries and wages | ||
| Employee benefit programs | ||
| Taxes and Licenses | ||
| Bad Debts | ||
| Depreciation | ||
| Amortization | ||
| Other Operating Expenses | ||
| Total Operating Expenses | ||
| Operating Income | ||
| Non-Operating Income | ||
| EBIT (Earnings Before Interest and Taxes) | ||
| Interest Expense | ||
| Earnings Before Taxes | ||
| Income Tax | ||
| Net Profit Net Income | ||
Financial Ratio Analysis
Financial ratio information can be used to benchmark how a Research and Development in the Physical, Engineering, and Life Sciences company compares to its peers. Accounting statistics are calculated from the industry-average for income statements and balance sheets.| Profitability & Valuation Ratios | Industry Average |
|---|---|
| Company valuation can be measured based on the firm's own performance, as well as in comparison against its industry competitors. These metrics show how the average company in the Research and Development in the Physical, Engineering, and Life Sciences industry is performing. | |
| Profit Margin Gross Profit Margin, Operating Profit Margin, and Net Profit Margin. Show company earnings relative to revenues. |
|
| Return on Equity (ROE) Return on Equity (ROE) is net income as a percentage of shareholders' equity. Shareholders' Equity is defined as the company's total assets minus total liabilities. ROE shows how much profits a company generates with the money shareholders invested (or with retained earnings). |
|
| Return on Assets (ROA) Return on Assets (ROA) is net income relative to total assets. The market research on Research and Development in the Physical, Engineering, and Life Sciences measures how efficiently the company leverages its assets to generate profit. ROA is calculated as Net Income divided by Total Assets. |
|
| Liquidity Ratios | Industry Average |
|---|---|
| Bankers and suppliers use liquidity to determine creditworthiness and identify potential threats to a company's financial viability. | |
| Current Ratio Measures a firm's ability to pay its debts over the next 12 months. |
|
| Quick Ratio (Acid Test) Calculates liquid assets relative to liabilities, excluding inventories. |
|
| Efficiency Ratios - Key Performance Indicators | Industry Average |
|---|---|
| Measure how quickly products and services sell, and effectively collections policies are implemented. | |
| Receivables Turnover Ratio If this number is low in your business when compared to the industry average in the research report, it may mean your payment terms are too lenient or that you are not doing a good enough job on collections. |
|
| Average Collection Period Based on the Receivables Turnover, this estimates the collection period in days. Calculated as 365 divided by the Receivables Turnover |
|
| Inventory Turnover A low turnover rate may point to overstocking, obsolescence, or deficiencies in the product line or marketing effort. |
|
| Fixed-Asset Turnover Generally, higher is better, since it indicates the business has less money tied up in fixed assets for each dollar of sales revenue. |
|
Compensation & Salary Surveys for Employees
Compensation statistics provides an accurate assessment of industry-specific jobs and national salary averages. This information can be used to identify which positions are most common, and high, low, and average annual wages.| Title | Percent of Workforce | Bottom Quartile | Average (Median) Salary | Upper Quartile |
|---|---|---|---|---|
| Management Occupations | 19% | Order at top of page |
||
| Chief Executives | 1% | |||
| General and Operations Managers | 4% | |||
| Operations Specialties Managers | 5% | |||
| Other Management Occupations | 8% | |||
| Business and Financial Operations Occupations | 11% | |||
| Business Operations Specialists | 9% | |||
| Computer and Mathematical Occupations | 15% | |||
| Computer Occupations | 12% | |||
| Software and Web Developers, Programmers, and Testers | 7% | |||
| Software Developers | 5% | |||
| Architecture and Engineering Occupations | 15% | |||
| Engineers | 12% | |||
| Life, Physical, and Social Science Occupations | 22% | |||
| Life Scientists | 11% | |||
| Biological Scientists | 5% | |||
| Medical Scientists | 5% | |||
| Medical Scientists, Except Epidemiologists | 5% | |||
| Life, Physical, and Social Science Technicians | 6% | |||
| Office and Administrative Support Occupations | 6% | |||
Research and Development in the Physical, Engineering, and Life Sciences Competitor Landscape & Key Companies [PREMIUM]
The most influential companies in the Research and Development in the Physical, Engineering, and Life Sciences industry and adjacent industries either have large market share or are developing new business models and methods that could disrupt the status quo. We look at leading and emerging companies in the Research and Development in the Physical, Engineering, and Life Sciences industry and adjacent sectors:| Market Leaders: Direct Competitors Companies with the largest market share, focused in this industry |
Market leaders: Diversified Competitors Largest companies that have diversified operations in this and other industries |
| Innovators: Direct Competitors Innovative, Emerging, and Disruptive Companies that may influence the future direction of the industry. |
Innovators: Diversified Competitors Innovators and Disruptors in adjacent industries that may also affect the Research and Development in the Physical, Engineering, and Life Sciences industry. |
Source:
Latest Industry News
- Neuroscience Reveals 4 Ways to Get Smarter, Make Better Decisions, and Stay Mentally Agile - If you’re wondering, “moderate exertion” involves things like fast walking. Slow jogging. Climbing stairs. Think any activity that, while not easy, will still allow you to carry on a conversation. “Vigorous exertion” is just what it sounds like: cycling, swimming, HIIT workouts, fast jogging, etc. (07/08/2025)
- Indicators 2025: Tech and innovation maintain a presence in NEPA - Stoss, President of The Institute, this week said the annual Indicators Report contains an overview of technology and innovation in Northeastern Pennsylvania. (07/05/2025)
- Trump’s All-Out Assault on Science Constitutes a “Mind-Boggling Own-Goal” - Its meddling and arbitrary cuts to staff, programs, and grants are killing an engine of American greatness, insiders say. (07/05/2025)
- Expansion-assisted selective plane illumination microscopy for nanoscale imaging of centimeter-scale tissues - Large-scale microscopy combined with tissue clearing and expansion enables nanoscale imaging of centimeter scale specimens. (06/30/2025)
- 6 Predictions: How AI Will Transform Scientific R&D In The Next Decade - Given the variability between labs and the unique nature of R&D work, custom, niche AI tools are going to become much more prevalent. (06/30/2025)
- Point Blank Enterprises, Temenos Will Create 350 Jobs In Florida - Body armor manufacturer will bring 300 jobs to Wakulla County, while fintech firm will employ 50 people in Orlando. (06/30/2025)
- China’s $138 Billion Bet on Embodied AI : The Future of Robots Is Here - How China’s $138B investment in embodied AI is revolutionizing robotics, reshaping industries, and redefining human-robot interaction (06/27/2025)
- Titans Space Recruits R&D And E&D Astronaut Candidates To Accelerate Its Cis-Lunar Space Infrastructure Developments - End Cis-Lunar Transportation System EarthLoop Orbital Cruise Flight Path Titans Spaceplane and Titans OrbitalPort S (06/25/2025)
- Mapúa debuts AI Engineering program for 2025-’26 - MAPUA University has announced the debut of its Bachelor of Science in Artificial Intelligence (AI) Engineering degree this academic year, 2025-2026, the first undergraduate program of its kind in the Philippines. (06/25/2025)
- Miniature implants could be a game changer for the peripheral nervous system - Bio-electronic medicine is a new form of therapy that uses electrical pulses to modulate nerve activity. The small implant delivering the pulses sits in the body, a wearable device delivers power to the implant and a mobile unit can be used to tweak the stimulation parameters. Source: Imec (06/25/2025)


Related Reports
Can't find what you're looking for? We have over a thousand
market research reports.
Ask us and an analyst will help you find what you need.


