| Standard Report | Premium Report | |
|---|---|---|
| Current State of the Industry |  |
 |
| Market Size (industry trends) |  |
 |
| Market Forecast (5-year projection) |  |
|
| Products/Services Breakdown |  |
|
| Revenue per State |  |
 |
| Financial Metrics |  |
 |
| Salary & Compensation Statistics |  |
 |
| Public Company Information |  |
 |
| Key Private Companies |  |
|
| Government Vendors |  |
|
| Instant Download - Available immediately upon purchase |  |
 |
Download both PDF and Excel


|
 |
 |
| Download now: |


2026 U.S. Industry Statistics & Market Forecast - Industrial Launderers
Market Size & Industry Statistics
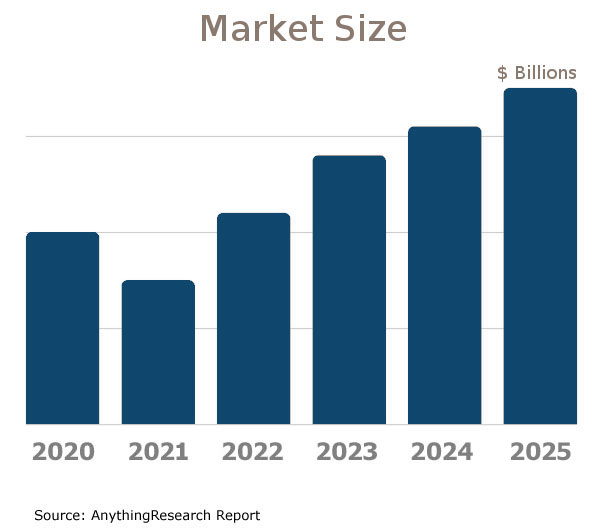
The total U.S. industry market size for Industrial Launderers:
Industry statistics cover all companies in the United States, both public and private, ranging in size from small businesses to market leaders.
In addition to revenue, the industry market analysis shows information on employees, companies, and average firm size.
Investors, banks, and business executives use growth rates and industry trends to understand the market outlook and opportunity.

| Statistics | 2020 2021 2022 2023 2024 2025 | |
|---|---|---|
| Market Size (Total Sales/Revenue) |
Order at top of page | |
| Total Firms | ||
| Total Employees | ||
| Average Revenue Per Firm | ||
| Average Employees Per Firm | ||
| Average Revenue Per Employee | ||
Market Forecast
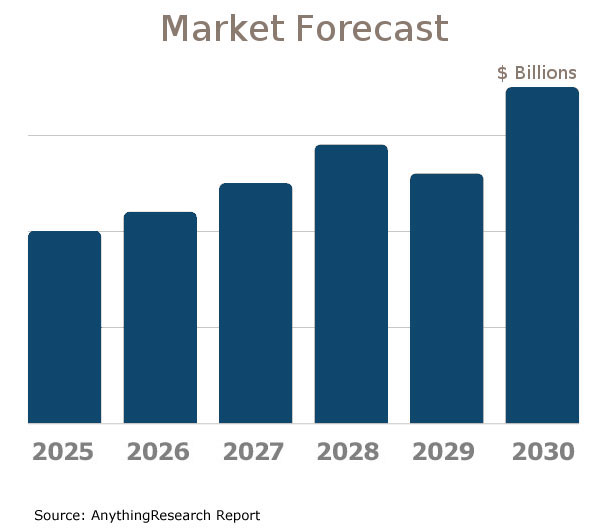
Market forecasts show the long term industry outlook and future growth trends. The following extended five-year forecast projects both short-term and long-term trends.

| Forecast / Industry Outlook | 2025 | 2026 | 2027 | 2028 | 2029 | 2030 |
|---|---|---|---|---|---|---|
| Market Forecast ($ millions) | ||||||
| Projected Industry Growth Rate (%) | ||||||
Industry Insights
Major trends affect the Industrial Launderers industry include:- Increased automation and robotics usage
- Sustainability and eco-friendly practices
- Water and energy conservation efforts
- Shift towards reusable textiles
- Integration of IoT and real-time data tracking
- Stringent regulations and compliance pressures
- Growth in healthcare and hospitality sectors
- Outsourcing by businesses to reduce costs
- Adoption of advanced detergents and cleaning technologies
- Impact of global economic fluctuations
Product & Services Breakdown
Research products and services in the Industrial Launderers industry generating sales. Note that products are broken into categories with different levels of classification.| Product Description | Number of Companies | Sales ($ millions) | Percent of Total Sales |
|---|---|---|---|
Industry Total |
|||
Commercial Laundry Services |
|||
Rental Of Uniforms, Linens, And Other Textiles |
|||
Rental Of - Linen Supply Garments, Including Gowns, Coats, Aprons. |
|||
Rental Of - Linen Supply Flatwork And Full Dry Linens |
|||
Rental Of - Industrial Garments, Excluding ""Clean Room"" Operations |
|||
Rental Of - Industrial ""Clean Room"" Garments |
|||
Rental Of - Industrial Wiping Cloths |
|||
Rental Of - Industrial Mats, Including Launderable And Unlaunderable |
|||
Rental Of - Industrial Mops, Cloths, And Miscellaneous Dust Control Items |
|||
Resale Of Merchandise |
|||
All Other Receipts |
|||
All Other Operating Receipts |
|||
U.S. Geographic Distribution: Revenue Statistics by State
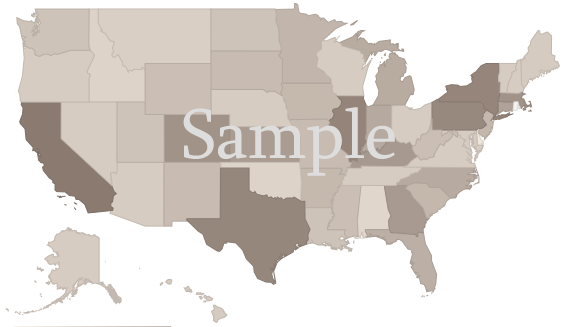
Market Size by State ($ millions) indicates how the industry's competition is distributed throughout the country. State-level information can identify areas with higher and lower industry market share than average.
Income Statement (Average Financial Metrics)
Financial metrics provide a snapshot view of a benchmark "average" company. Key business metrics show revenue and operating costs. The data collected covers both public and private companies.| Industry Average | Percent of Sales (Industry Benchmark) |
|
|---|---|---|
| Total Revenue | Order at top of page |
|
| Operating Revenue | ||
| Cost of Goods Sold | ||
| Gross Profit | ||
Operating Expenses | ||
| Pension, profit sharing plans, stock, annuity | ||
| Repairs | ||
| Rent paid on business property | ||
| Charitable Contributions | ||
| Depletion | ||
| Domestic production activities deduction | ||
| Advertising | ||
| Compensation of officers | ||
| Salaries and wages | ||
| Employee benefit programs | ||
| Taxes and Licenses | ||
| Bad Debts | ||
| Depreciation | ||
| Amortization | ||
| Other Operating Expenses | ||
| Total Operating Expenses | ||
| Operating Income | ||
| Non-Operating Income | ||
| EBIT (Earnings Before Interest and Taxes) | ||
| Interest Expense | ||
| Earnings Before Taxes | ||
| Income Tax | ||
| Net Profit Net Income | ||
Financial Ratio Analysis
Financial ratio information can be used to benchmark how a Industrial Launderers company compares to its peers. Accounting statistics are calculated from the industry-average for income statements and balance sheets.| Profitability & Valuation Ratios | Industry Average |
|---|---|
| Company valuation can be measured based on the firm's own performance, as well as in comparison against its industry competitors. These metrics show how the average company in the Industrial Launderers industry is performing. | |
| Profit Margin Gross Profit Margin, Operating Profit Margin, and Net Profit Margin. Show company earnings relative to revenues. |
|
| Return on Equity (ROE) Return on Equity (ROE) is net income as a percentage of shareholders' equity. Shareholders' Equity is defined as the company's total assets minus total liabilities. ROE shows how much profits a company generates with the money shareholders invested (or with retained earnings). |
|
| Return on Assets (ROA) Return on Assets (ROA) is net income relative to total assets. The market research on Industrial Launderers measures how efficiently the company leverages its assets to generate profit. ROA is calculated as Net Income divided by Total Assets. |
|
| Liquidity Ratios | Industry Average |
|---|---|
| Bankers and suppliers use liquidity to determine creditworthiness and identify potential threats to a company's financial viability. | |
| Current Ratio Measures a firm's ability to pay its debts over the next 12 months. |
|
| Quick Ratio (Acid Test) Calculates liquid assets relative to liabilities, excluding inventories. |
|
| Efficiency Ratios - Key Performance Indicators | Industry Average |
|---|---|
| Measure how quickly products and services sell, and effectively collections policies are implemented. | |
| Receivables Turnover Ratio If this number is low in your business when compared to the industry average in the research report, it may mean your payment terms are too lenient or that you are not doing a good enough job on collections. |
|
| Average Collection Period Based on the Receivables Turnover, this estimates the collection period in days. Calculated as 365 divided by the Receivables Turnover |
|
| Inventory Turnover A low turnover rate may point to overstocking, obsolescence, or deficiencies in the product line or marketing effort. |
|
| Fixed-Asset Turnover Generally, higher is better, since it indicates the business has less money tied up in fixed assets for each dollar of sales revenue. |
|
Compensation & Salary Surveys for Employees
Compensation statistics provides an accurate assessment of industry-specific jobs and national salary averages. This information can be used to identify which positions are most common, and high, low, and average annual wages.| Title | Percent of Workforce | Bottom Quartile | Average (Median) Salary | Upper Quartile |
|---|---|---|---|---|
| Management Occupations | 5% | Order at top of page |
||
| Chief Executives | 0% | |||
| General and Operations Managers | 4% | |||
| Sales and Related Occupations | 14% | |||
| Retail Sales Workers | 10% | |||
| Counter and Rental Clerks and Parts Salespersons | 8% | |||
| Counter and Rental Clerks | 8% | |||
| Office and Administrative Support Occupations | 7% | |||
| Production Occupations | 53% | |||
| Textile, Apparel, and Furnishings Workers | 47% | |||
| Laundry and Dry-Cleaning Workers | 35% | |||
| Laundry and Dry-Cleaning Workers | 35% | |||
| Pressers, Textile, Garment, and Related Materials | 11% | |||
| Pressers, Textile, Garment, and Related Materials | 11% | |||
| Transportation and Material Moving Occupations | 16% | |||
| Motor Vehicle Operators | 11% | |||
| Driver/Sales Workers and Truck Drivers | 11% | |||
| Driver/Sales Workers | 8% | |||
Industrial Launderers Competitor Landscape & Key Companies [PREMIUM]
The most influential companies in the Industrial Launderers industry and adjacent industries either have large market share or are developing new business models and methods that could disrupt the status quo. We look at leading and emerging companies in the Industrial Launderers industry and adjacent sectors:| Market Leaders: Direct Competitors Companies with the largest market share, focused in this industry |
Market leaders: Diversified Competitors Largest companies that have diversified operations in this and other industries |
| Innovators: Direct Competitors Innovative, Emerging, and Disruptive Companies that may influence the future direction of the industry. |
Innovators: Diversified Competitors Innovators and Disruptors in adjacent industries that may also affect the Industrial Launderers industry. |
Latest Industry News
- From Muddy to Medal: How Assiniboine Water Becomes Award-Winning - In the heart of the Portage la Prairie Water Treatment Plant, a complex network of pipes, clarifiers, filters, and chemical systems work together to convert highly turbid water from the Assiniboine River into award-winning drinking water. (07/07/2025)
- How Tether became money-launderers’ dream currency - How could a British street gang be so closely connected to a Russian cybercrime influencer? The subsequent investigation, known as Operation Destabilise, would last for years, draw in other law-enforcement agencies in Europe, (07/04/2025)
- Gartex Texprocess India Partners With Drycleaners And Launderers Association Of India To Debut The Textile Care Forum - Reflecting the evolving dynamics of India's textile care industry, this strategic development marks a pivotal step forward in strengthening the segme (07/03/2025)
- Jail for Mansfield textiles boss who laundered money for ‘cruel and malicious’ romance scammers - The boss of former Mansfield textiles business Savanna Rags has been jailed after laundering almost £2million from a “cruel and malicious” romance fraud operation that devastated vulnerable victims. (07/02/2025)
- money launderers | The Daily Star - The Bangladesh Financial Intelligence Unit (BFIU) has confiscated Tk 1,294 crore from money launderers since the fiscal year of 2016-17 as per court orders, said the agency yesterday. (06/22/2025)
- Momen Countries are reluctant to share information about money launderers - They're indirectly encouraging money laundering,” Momen said while asking about updates on the list of money launderers. “If you invest money in their country, those countries will reward you with permanent residency and citizenship. This is a very well-practised trend in many countries,” he said. (06/11/2025)
- Cambodia is home to world’s most powerful criminal network: report - The network’s illegal activities threaten global economic and political stability, says Jacob Sims, a transnational crime expert. (05/26/2025)
- Currency Trafficking, BDCS And CBN - By: Sir Henry Olujimi Boyo (Les Leba) first published in October 2012 INTRO: Last week this column republished “CBN and the Ostrich.” This piece criticizes the CBN for enabling banks to prioritize speculative forex trading over real sector support, (05/26/2025)
- The Online Scam Industry Is Capitalism Built on Slave Labor - Centered in the lawless region of Southeast Asia known as the Golden Triangle, the scam industry is a new kind of capitalism built on corruption, organized crime, and slave labor — and it’s growing. (05/14/2025)
- Iowa State's new state-of-the-art industrial engineering building bolstered by $42M gift - Iowa State University opened a new 80,000-square-foot industrial engineering building. A $42 million donation from C.G. “Turk” and Joyce A. McEwen Therkildsen is the largest gift for an academic building in Iowa State University history. The building ... (05/06/2025)


