| Standard Report | Premium Report | |
|---|---|---|
| Current State of the Industry |  |
 |
| Market Size (industry trends) |  |
 |
| Market Forecast (5-year projection) |  |
|
| Products/Services Breakdown |  |
|
| Revenue per State |  |
 |
| Financial Metrics |  |
 |
| Salary & Compensation Statistics |  |
 |
| Public Company Information |  |
 |
| Key Private Companies |  |
|
| Government Vendors |  |
|
| Instant Download - Available immediately upon purchase |  |
 |
Download both PDF and Excel


|
 |
 |
| Download now: |


2026 U.S. Industry Statistics & Market Forecast - Crushed and Broken Stone Mining and Quarrying
Market Size & Industry Statistics
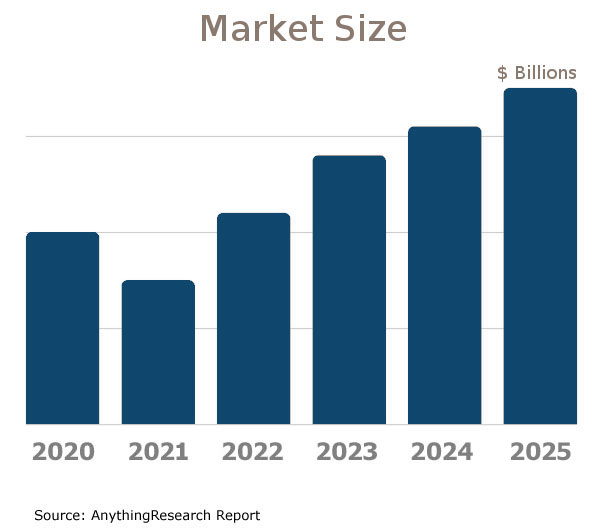
The total U.S. industry market size for Crushed and Broken Stone Mining and Quarrying:
Industry statistics cover all companies in the United States, both public and private, ranging in size from small businesses to market leaders.
In addition to revenue, the industry market analysis shows information on employees, companies, and average firm size.
Investors, banks, and business executives use growth rates and industry trends to understand the market outlook and opportunity.

| Statistics | 2020 2021 2022 2023 2024 2025 | |
|---|---|---|
| Market Size (Total Sales/Revenue) |
Order at top of page | |
| Total Firms | ||
| Total Employees | ||
| Average Revenue Per Firm | ||
| Average Employees Per Firm | ||
| Average Revenue Per Employee | ||
Market Forecast
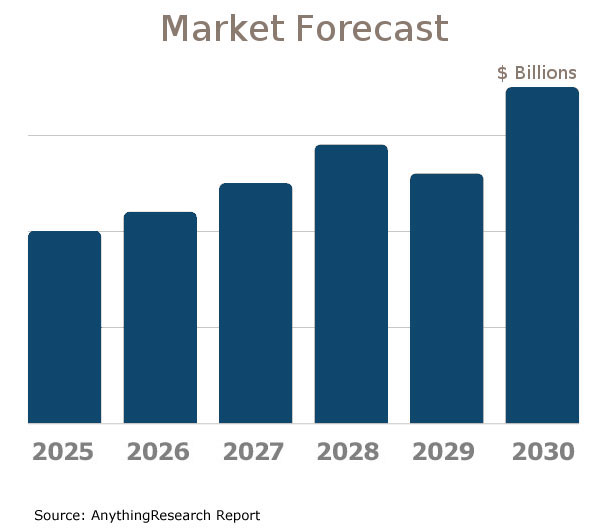
Market forecasts show the long term industry outlook and future growth trends. The following extended five-year forecast projects both short-term and long-term trends.

| Forecast / Industry Outlook | 2025 | 2026 | 2027 | 2028 | 2029 | 2030 |
|---|---|---|---|---|---|---|
| Market Forecast ($ millions) | ||||||
| Projected Industry Growth Rate (%) | ||||||
Industry Insights
Major trends affect the Crushed and Broken Stone Mining and Quarrying industry include:- Increasing regulation and environmental compliance costs
- Shift towards sustainable and eco-friendly mining practices
- Technological advancements in mining equipment and techniques
- Growing demand for aggregate in construction and infrastructure projects
- Impact of economic cycles on construction and infrastructure investment
- Globalization of markets leading to increased competition and price pressures
- Expansion of recycling practices reducing demand for new raw materials
- Urbanization influencing local market dynamics
- Rising energy costs affecting operational expenses
- Integration of automation and data analytics to enhance productivity and safety
- Increase in mergers and acquisitions to consolidate market presence
- Fluctuations in raw material prices influencing profitability
- Security concerns related to mining sites and cyber threats impacting operations
U.S. Geographic Distribution: Revenue Statistics by State
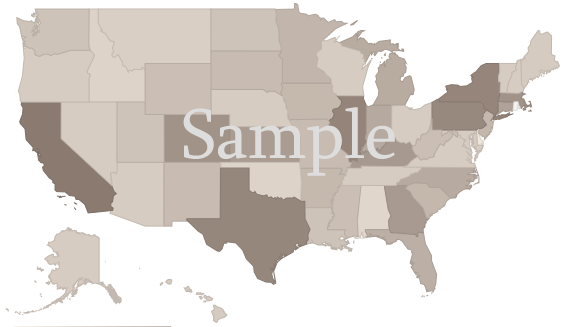
Market Size by State ($ millions) indicates how the industry's competition is distributed throughout the country. State-level information can identify areas with higher and lower industry market share than average.
Income Statement (Average Financial Metrics)
Financial metrics provide a snapshot view of a benchmark "average" company. Key business metrics show revenue and operating costs. The data collected covers both public and private companies.| Industry Average | Percent of Sales (Industry Benchmark) |
|
|---|---|---|
| Total Revenue | Order at top of page |
|
| Operating Revenue | ||
| Cost of Goods Sold | ||
| Gross Profit | ||
Operating Expenses | ||
| Pension, profit sharing plans, stock, annuity | ||
| Repairs | ||
| Rent paid on business property | ||
| Charitable Contributions | ||
| Depletion | ||
| Domestic production activities deduction | ||
| Advertising | ||
| Compensation of officers | ||
| Salaries and wages | ||
| Employee benefit programs | ||
| Taxes and Licenses | ||
| Bad Debts | ||
| Depreciation | ||
| Amortization | ||
| Other Operating Expenses | ||
| Total Operating Expenses | ||
| Operating Income | ||
| Non-Operating Income | ||
| EBIT (Earnings Before Interest and Taxes) | ||
| Interest Expense | ||
| Earnings Before Taxes | ||
| Income Tax | ||
| Net Profit Net Income | ||
Financial Ratio Analysis
Financial ratio information can be used to benchmark how a Crushed and Broken Stone Mining and Quarrying company compares to its peers. Accounting statistics are calculated from the industry-average for income statements and balance sheets.| Profitability & Valuation Ratios | Industry Average |
|---|---|
| Company valuation can be measured based on the firm's own performance, as well as in comparison against its industry competitors. These metrics show how the average company in the Crushed and Broken Stone Mining and Quarrying industry is performing. | |
| Profit Margin Gross Profit Margin, Operating Profit Margin, and Net Profit Margin. Show company earnings relative to revenues. |
|
| Return on Equity (ROE) Return on Equity (ROE) is net income as a percentage of shareholders' equity. Shareholders' Equity is defined as the company's total assets minus total liabilities. ROE shows how much profits a company generates with the money shareholders invested (or with retained earnings). |
|
| Return on Assets (ROA) Return on Assets (ROA) is net income relative to total assets. The market research on Crushed and Broken Stone Mining and Quarrying measures how efficiently the company leverages its assets to generate profit. ROA is calculated as Net Income divided by Total Assets. |
|
| Liquidity Ratios | Industry Average |
|---|---|
| Bankers and suppliers use liquidity to determine creditworthiness and identify potential threats to a company's financial viability. | |
| Current Ratio Measures a firm's ability to pay its debts over the next 12 months. |
|
| Quick Ratio (Acid Test) Calculates liquid assets relative to liabilities, excluding inventories. |
|
| Efficiency Ratios - Key Performance Indicators | Industry Average |
|---|---|
| Measure how quickly products and services sell, and effectively collections policies are implemented. | |
| Receivables Turnover Ratio If this number is low in your business when compared to the industry average in the research report, it may mean your payment terms are too lenient or that you are not doing a good enough job on collections. |
|
| Average Collection Period Based on the Receivables Turnover, this estimates the collection period in days. Calculated as 365 divided by the Receivables Turnover |
|
| Inventory Turnover A low turnover rate may point to overstocking, obsolescence, or deficiencies in the product line or marketing effort. |
|
| Fixed-Asset Turnover Generally, higher is better, since it indicates the business has less money tied up in fixed assets for each dollar of sales revenue. |
|
Compensation & Salary Surveys for Employees
Compensation statistics provides an accurate assessment of industry-specific jobs and national salary averages. This information can be used to identify which positions are most common, and high, low, and average annual wages.| Title | Percent of Workforce | Bottom Quartile | Average (Median) Salary | Upper Quartile |
|---|---|---|---|---|
| Management Occupations | 6% | Order at top of page |
||
| General and Operations Managers | 3% | |||
| Office and Administrative Support Occupations | 9% | |||
| Construction and Extraction Occupations | 41% | |||
| Construction Trades Workers | 13% | |||
| Construction Equipment Operators | 10% | |||
| Operating Engineers and Other Construction Equipment Operators | 10% | |||
| Extraction Workers | 24% | |||
| Surface Mining Machine Operators and Earth Drillers | 14% | |||
| Excavating and Loading Machine and Dragline Operators, Surface Mining | 13% | |||
| Underground Mining Machine Operators | 6% | |||
| Installation, Maintenance, and Repair Occupations | 10% | |||
| Other Installation, Maintenance, and Repair Occupations | 5% | |||
| Production Occupations | 12% | |||
| Other Production Occupations | 9% | |||
| Transportation and Material Moving Occupations | 17% | |||
| Motor Vehicle Operators | 12% | |||
| Driver/Sales Workers and Truck Drivers | 12% | |||
| Heavy and Tractor-Trailer Truck Drivers | 11% | |||
Crushed and Broken Stone Mining and Quarrying Competitor Landscape & Key Companies [PREMIUM]
The most influential companies in the Crushed and Broken Stone Mining and Quarrying industry and adjacent industries either have large market share or are developing new business models and methods that could disrupt the status quo. We look at leading and emerging companies in the Crushed and Broken Stone Mining and Quarrying industry and adjacent sectors:| Market Leaders: Direct Competitors Companies with the largest market share, focused in this industry |
Market leaders: Diversified Competitors Largest companies that have diversified operations in this and other industries |
| Innovators: Direct Competitors Innovative, Emerging, and Disruptive Companies that may influence the future direction of the industry. |
Innovators: Diversified Competitors Innovators and Disruptors in adjacent industries that may also affect the Crushed and Broken Stone Mining and Quarrying industry. |
Source:
Latest Industry News
- Man found in crushed vehicle at bottom of quarry - Officials responded to the bottom of the quarry's northeastern area around 2:15 p.m after being notified by Hanson Material Service about a vehicle that had been found. (07/02/2025)
- County Commission approves quarry permit for Rockland Stone - The Lyon County Commission approved an application for an Agricultural Conditional-Use permit for a quarry by Rockland Stone to be excavated at the 100 block of Rd. 140. (06/26/2025)
- The Bright Side: How crushed stone could help fight climate change - From sugar plantations in Brazil to tea estates in India, crushed rock is being sprinkled across large stretches of farmland globally in a novel bid to combat climate change. The technique is called Enhanced Rock Weathering (ERW) and aims to speed up the natural capture (06/24/2025)
- Rock on: how crushed stone could help fight climate change - From sugar plantations in Brazil to tea estates in India, crushed rock is being sprinkled across large stretches of farmland globally in a novel bid to combat climate change. (06/22/2025)
- Illegal mining: HC takes serious view of stone crushers not being shifted away from Ganga - Hindustan Times - Illegal mining: HC takes serious view of stone crushers not being shifted away from Ganga | Latest News India (06/13/2025)
- All Hagga Basin Unique Schematics and Locations - IGN - The Hagga Basin is aprimary region in Dune Awakening, and where every new player will begin their journey on Arrakis. In the scorched, unforgiving expanse, (06/12/2025)
- Sivaganga quarry tragedy: TN govt orders statewide inspection of stone quarries - Chennai: In the wake of a deadly rockslide at a stone quarry in Sivaganga that claimed six lives, the Tamil Nadu Department of Geology and Mining has issued a statewide directive to inspect stone ... (05/24/2025)
- Inside the Largest Quarry in the World: How the Largest Man-Made Quarry Changed Mining Forever - Discover the largest quarry in the world, a colossal site where vast amounts of stone and minerals are extracted to fuel construction and industry globally. This video takes you inside the incredible scale and operations of the world’s biggest quarry, (05/23/2025)
- Five workers killed in rockslide at Tamil Nadu’s Mallakottai stone quarry, CM announces solatium - Five workers were killed in a rockslide at a stone quarry located at Mallakottai in Sivaganga district on Tuesday (May 20, 2025). Another worker sustained injuries and was hospitalised. (05/20/2025)
- Two stone quarries in Tiruppur to be penalised for mining beyond limit - TIRUPPUR: The district collector has ordered the Revenue Divisional Officer (RDO) of Tiruppur to impose fines on two stone quarries in Kodangipalayam for mining beyond the permitted limits ... (05/01/2025)


Related Reports
Can't find what you're looking for? We have over a thousand
market research reports.
Ask us and an analyst will help you find what you need.


