| Standard Report | Premium Report | |
|---|---|---|
| Current State of the Industry |  |
 |
| Market Size (industry trends) |  |
 |
| Market Forecast (5-year projection) |  |
|
| Products/Services Breakdown |  |
|
| Revenue per State |  |
 |
| Financial Metrics |  |
 |
| Salary & Compensation Statistics |  |
 |
| Public Company Information |  |
 |
| Key Private Companies |  |
|
| Government Vendors |  |
|
| Instant Download - Available immediately upon purchase |  |
 |
Download both PDF and Excel


|
 |
 |
| Download now: |


2026 U.S. Industry Statistics & Market Forecast - Securities and Commodity Exchanges
Market Size & Industry Statistics
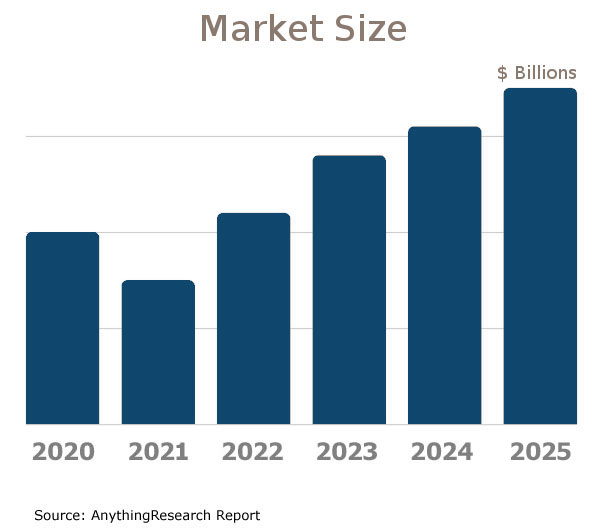
The total U.S. industry market size for Securities and Commodity Exchanges:
Industry statistics cover all companies in the United States, both public and private, ranging in size from small businesses to market leaders.
In addition to revenue, the industry market analysis shows information on employees, companies, and average firm size.
Investors, banks, and business executives use growth rates and industry trends to understand the market outlook and opportunity.

| Statistics | 2020 2021 2022 2023 2024 2025 | |
|---|---|---|
| Market Size (Total Sales/Revenue) |
Order at top of page | |
| Total Firms | ||
| Total Employees | ||
| Average Revenue Per Firm | ||
| Average Employees Per Firm | ||
| Average Revenue Per Employee | ||
Market Forecast
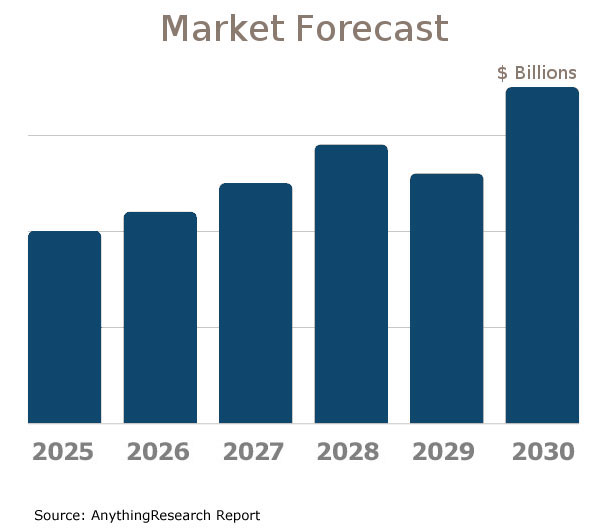
Market forecasts show the long term industry outlook and future growth trends. The following extended five-year forecast projects both short-term and long-term trends.

| Forecast / Industry Outlook | 2025 | 2026 | 2027 | 2028 | 2029 | 2030 |
|---|---|---|---|---|---|---|
| Market Forecast ($ millions) | ||||||
| Projected Industry Growth Rate (%) | ||||||
Industry Insights
Major trends affect the Securities and Commodity Exchanges industry include:- Technological advancements in trading platforms
- Increased regulatory scrutiny and compliance requirements
- Growth of sustainable and green investments
- Rising cybersecurity threats and measures
- Integration of blockchain and cryptocurrencies
- Shift towards automation and AI in trading
- Globalization and interconnectivity of markets
- Changes in market demographics and investor behavior
- Impact of economic volatility on trading volumes
- Adoption of remote and hybrid work models
Product & Services Breakdown
Research products and services in the Securities and Commodity Exchanges industry generating sales. Note that products are broken into categories with different levels of classification.| Product Description | Number of Companies | Sales ($ millions) | Percent of Total Sales |
|---|---|---|---|
Industry Total |
|||
Support Services For Financial And Commodity Markets |
|||
Trade Execution, Clearing, And Settlement Services For Security And Commodity Contracts |
|||
Trading And Clearing System Services For Security And Commodity Contracts |
|||
Listing Services For Security And Commodity Contracts |
|||
Other Products Supporting Financial Services - Fees |
|||
Regulation Of Securities Markets |
|||
U.S. Geographic Distribution: Revenue Statistics by State
Market Size by State ($ millions) indicates how the industry's competition is distributed throughout the country. State-level information can identify areas with higher and lower industry market share than average.
Income Statement (Average Financial Metrics)
Financial metrics provide a snapshot view of a benchmark "average" company. Key business metrics show revenue and operating costs. The data collected covers both public and private companies.| Industry Average | Percent of Sales (Industry Benchmark) |
|
|---|---|---|
| Total Revenue | Order at top of page |
|
| Operating Revenue | ||
| Cost of Goods Sold | ||
| Gross Profit | ||
Operating Expenses | ||
| Pension, profit sharing plans, stock, annuity | ||
| Repairs | ||
| Rent paid on business property | ||
| Charitable Contributions | ||
| Depletion | ||
| Domestic production activities deduction | ||
| Advertising | ||
| Compensation of officers | ||
| Salaries and wages | ||
| Employee benefit programs | ||
| Taxes and Licenses | ||
| Bad Debts | ||
| Depreciation | ||
| Amortization | ||
| Other Operating Expenses | ||
| Total Operating Expenses | ||
| Operating Income | ||
| Non-Operating Income | ||
| EBIT (Earnings Before Interest and Taxes) | ||
| Interest Expense | ||
| Earnings Before Taxes | ||
| Income Tax | ||
| Net Profit Net Income | ||
Financial Ratio Analysis
Financial ratio information can be used to benchmark how a Securities and Commodity Exchanges company compares to its peers. Accounting statistics are calculated from the industry-average for income statements and balance sheets.| Profitability & Valuation Ratios | Industry Average |
|---|---|
| Company valuation can be measured based on the firm's own performance, as well as in comparison against its industry competitors. These metrics show how the average company in the Securities and Commodity Exchanges industry is performing. | |
| Profit Margin Gross Profit Margin, Operating Profit Margin, and Net Profit Margin. Show company earnings relative to revenues. |
|
| Return on Equity (ROE) Return on Equity (ROE) is net income as a percentage of shareholders' equity. Shareholders' Equity is defined as the company's total assets minus total liabilities. ROE shows how much profits a company generates with the money shareholders invested (or with retained earnings). |
|
| Return on Assets (ROA) Return on Assets (ROA) is net income relative to total assets. The market research on Securities and Commodity Exchanges measures how efficiently the company leverages its assets to generate profit. ROA is calculated as Net Income divided by Total Assets. |
|
| Liquidity Ratios | Industry Average |
|---|---|
| Bankers and suppliers use liquidity to determine creditworthiness and identify potential threats to a company's financial viability. | |
| Current Ratio Measures a firm's ability to pay its debts over the next 12 months. |
|
| Quick Ratio (Acid Test) Calculates liquid assets relative to liabilities, excluding inventories. |
|
| Efficiency Ratios - Key Performance Indicators | Industry Average |
|---|---|
| Measure how quickly products and services sell, and effectively collections policies are implemented. | |
| Receivables Turnover Ratio If this number is low in your business when compared to the industry average in the research report, it may mean your payment terms are too lenient or that you are not doing a good enough job on collections. |
|
| Average Collection Period Based on the Receivables Turnover, this estimates the collection period in days. Calculated as 365 divided by the Receivables Turnover |
|
| Inventory Turnover A low turnover rate may point to overstocking, obsolescence, or deficiencies in the product line or marketing effort. |
|
| Fixed-Asset Turnover Generally, higher is better, since it indicates the business has less money tied up in fixed assets for each dollar of sales revenue. |
|
Compensation & Salary Surveys for Employees
Compensation statistics provides an accurate assessment of industry-specific jobs and national salary averages. This information can be used to identify which positions are most common, and high, low, and average annual wages.| Title | Percent of Workforce | Bottom Quartile | Average (Median) Salary | Upper Quartile |
|---|---|---|---|---|
| Management Occupations | 14% | Order at top of page |
||
| Chief Executives | 0% | |||
| General and Operations Managers | 4% | |||
| Operations Specialties Managers | 7% | |||
| Financial Managers | 5% | |||
| Financial Managers | 5% | |||
| Business and Financial Operations Occupations | 42% | |||
| Business Operations Specialists | 6% | |||
| Financial Specialists | 35% | |||
| Financial Analysts and Advisors | 29% | |||
| Financial and Investment Analysts | 8% | |||
| Personal Financial Advisors | 20% | |||
| Computer and Mathematical Occupations | 7% | |||
| Computer Occupations | 6% | |||
| Sales and Related Occupations | 17% | |||
| Sales Representatives, Services | 16% | |||
| Securities, Commodities, and Financial Services Sales Agents | 16% | |||
| Securities, Commodities, and Financial Services Sales Agents | 16% | |||
| Office and Administrative Support Occupations | 19% | |||
| Information and Record Clerks | 7% | |||
| Secretaries and Administrative Assistants | 5% | |||
| Secretaries and Administrative Assistants | 5% | |||
Securities and Commodity Exchanges Competitor Landscape & Key Companies [PREMIUM]
The most influential companies in the Securities and Commodity Exchanges industry and adjacent industries either have large market share or are developing new business models and methods that could disrupt the status quo. We look at leading and emerging companies in the Securities and Commodity Exchanges industry and adjacent sectors:| Market Leaders: Direct Competitors Companies with the largest market share, focused in this industry |
Market leaders: Diversified Competitors Largest companies that have diversified operations in this and other industries |
| Innovators: Direct Competitors Innovative, Emerging, and Disruptive Companies that may influence the future direction of the industry. |
Innovators: Diversified Competitors Innovators and Disruptors in adjacent industries that may also affect the Securities and Commodity Exchanges industry. |
Latest Industry News
- Senate battles crypto regulation as 'Crypto Week' approaches - () - Senators clashed in a U.S. Senate Banking Committee hearing Wednesday over regulations on cryptocurrency as the House of Representatives prepares to vote on legislation regulating the (07/09/2025)
- Key functions of SEC under investment and securities Act 2025 - On March 25, 2025, the Investment and Securities Act 2025 (“the Act”) came into effect, repealing the Investments and Securities Act, (07/09/2025)
- Commodity Trading Entering Mainstream Puts Pressure on Congress - Opinion: Cadwalader partners Peter Malyshev, Mercedes Tunstall, and Daniel Meade explain what the explosion in popularity of nonprofessional commodity trading means for financial markets and consumer protection regulations. (07/09/2025)
- SEBI proposes reduced IT capacity for commodity stock exchanges citing underutilisation - The Securities and Exchange Board of India (SEBI), the markets regulator, has proposed lowered IT systems capacity at commodity stock exchanges. The reduction has been proposed based on feedback from such exchanges. (06/30/2025)
- SEBI proposes IT load norms for commodity exchanges, CCs - The Securities and Exchange Board of India (SEBI) has proposed commodity exchanges and clearing corporations to maintain twice the installed capacity of the projected peak load for critical IT ... (06/30/2025)
- MCX vs BSE valuation: Is the premium justified? A deep dive into commodity vs equity exchanges - Exchange stocks are in focus after Securities and Exchange Board of India chairman Tuhin Kanta Pandey said over the weekend there were no obstacles for the National Stock Exchange of India’s ... (06/26/2025)
- Intercontinental Exchange (ICE) Gained from Rising Commodity Prices and Global Volatility - Parnassus Investments, an investment management company, released the “Parnassus Core Equity Fund” first quarter 2025 investor letter. A copy of the letter can be downloaded here. (06/26/2025)
- BioSig Appoints Former OppenheimerFunds and Wafra Inc Executive, Mitch Williams, CFA, as Chief Investment Officer - Mr. Mitch Williams, former OppenheimerFunds and Wafra Inc. executive and Strategic Advisor to Streamex, will be appointed Chief Investment Officer of the combined company. Mr. Williams brings over 20 years of experience in capital markets, having held senior executive roles at OppenheimerFunds, and Wafra Inc. (05/28/2025)
- 4 Stocks to Watch From the Prospering Securities and Exchanges Industry - A compelling and diversified product portfolio helps drive the revenues of Zacks Securities and Exchanges industry players. A rise in trading volumes, product expansion through prudent acquisitions and the increased adoption of a greater number of crypto assets are expected to benefit Intercontinental Exchange ICE, (05/27/2025)
- CMDT: What Is PIMCO Commodity Strategy Active ETF, And Who Should Hold It? - CMDT is an actively managed commodity ETF, outpacing the Bloomberg Commodity Index. Learn about its strategy, performance, and sector allocation here. (05/27/2025)


