| Standard Report | Premium Report | |
|---|---|---|
| Current State of the Industry |  |
 |
| Market Size (industry trends) |  |
 |
| Market Forecast (5-year projection) |  |
|
| Products/Services Breakdown |  |
|
| Revenue per State |  |
 |
| Financial Metrics |  |
 |
| Salary & Compensation Statistics |  |
 |
| Public Company Information |  |
 |
| Key Private Companies |  |
|
| Government Vendors |  |
|
| Instant Download - Available immediately upon purchase |  |
 |
Download both PDF and Excel


|
 |
 |
| Download now: |


2026 U.S. Industry Statistics & Market Forecast - Wine and Distilled Alcoholic Beverage Merchant Wholesalers
Market Size & Industry Statistics
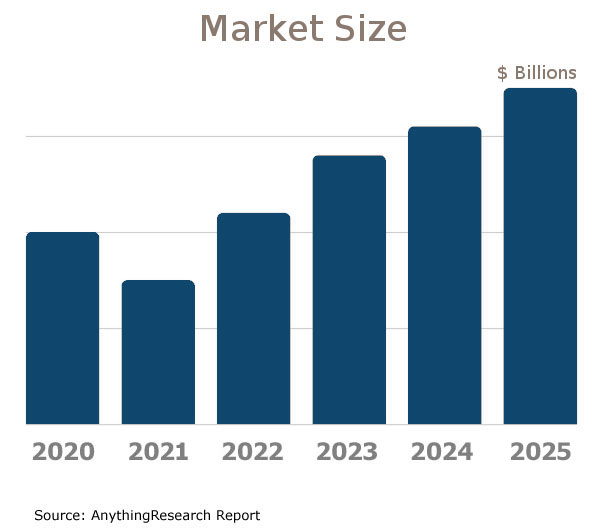
The total U.S. industry market size for Wine and Distilled Alcoholic Beverage Merchant Wholesalers:
Industry statistics cover all companies in the United States, both public and private, ranging in size from small businesses to market leaders.
In addition to revenue, the industry market analysis shows information on employees, companies, and average firm size.
Investors, banks, and business executives use growth rates and industry trends to understand the market outlook and opportunity.

| Statistics | 2020 2021 2022 2023 2024 2025 | |
|---|---|---|
| Market Size (Total Sales/Revenue) |
Order at top of page | |
| Total Firms | ||
| Total Employees | ||
| Average Revenue Per Firm | ||
| Average Employees Per Firm | ||
| Average Revenue Per Employee | ||
Market Forecast
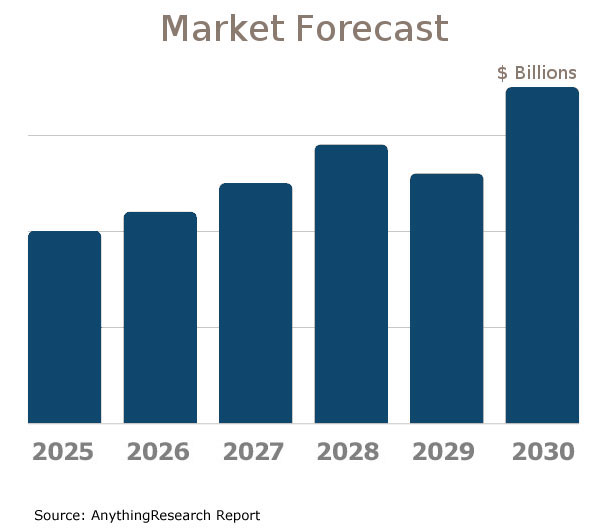
Market forecasts show the long term industry outlook and future growth trends. The following extended five-year forecast projects both short-term and long-term trends.

| Forecast / Industry Outlook | 2025 | 2026 | 2027 | 2028 | 2029 | 2030 |
|---|---|---|---|---|---|---|
| Market Forecast ($ millions) | ||||||
| Projected Industry Growth Rate (%) | ||||||
Industry Insights
Major trends affect the Wine and Distilled Alcoholic Beverage Merchant Wholesalers industry include:- Increased demand for premium and craft products
- Shift towards organic and sustainable wines and spirits
- Growing e-commerce and online sales channels
- Impact of tariffs and global trade policies
- Consumer preference for low-alcohol and non-alcoholic options
- Rise in health-conscious consumption habits
- Expansion of direct-to-consumer sales models
- Technological advancements in supply chain management
- Fluctuations in raw material costs
- Regulatory changes and increased compliance costs
- Influence of millennial and Generation Z consumers
- Greater emphasis on diversity and inclusion in brand portfolios
- Growing popularity of RTD (Ready-to-Drink) beverages
- Impact of climate change on production areas
- Increased market consolidation and strategic partnerships
Product & Services Breakdown
Research products and services in the Wine and Distilled Alcoholic Beverage Merchant Wholesalers industry generating sales. Note that products are broken into categories with different levels of classification.| Product Description | Number of Companies | Sales ($ millions) | Percent of Total Sales |
|---|---|---|---|
Industry Total |
|||
Soft Drinks, Bottled Water, Juices, And Nonalcoholic Beverages |
|||
Nonalcoholic Beer And Mixers |
|||
Sport And Energy Drinks, Including Bottled And Canned Coffee And Tea |
|||
Beer, Ale, And Brewers' Products |
|||
Beer And Ale |
|||
Wine And Distilled Alcoholic Beverages |
|||
Wine |
|||
Distilled Liquor, Including Premixed Alcoholic Drinks |
|||
U.S. Geographic Distribution: Revenue Statistics by State
Market Size by State ($ millions) indicates how the industry's competition is distributed throughout the country. State-level information can identify areas with higher and lower industry market share than average.
Income Statement (Average Financial Metrics)
Financial metrics provide a snapshot view of a benchmark "average" company. Key business metrics show revenue and operating costs. The data collected covers both public and private companies.| Industry Average | Percent of Sales (Industry Benchmark) |
|
|---|---|---|
| Total Revenue | Order at top of page |
|
| Operating Revenue | ||
| Cost of Goods Sold | ||
| Gross Profit | ||
Operating Expenses | ||
| Pension, profit sharing plans, stock, annuity | ||
| Repairs | ||
| Rent paid on business property | ||
| Charitable Contributions | ||
| Depletion | ||
| Domestic production activities deduction | ||
| Advertising | ||
| Compensation of officers | ||
| Salaries and wages | ||
| Employee benefit programs | ||
| Taxes and Licenses | ||
| Bad Debts | ||
| Depreciation | ||
| Amortization | ||
| Other Operating Expenses | ||
| Total Operating Expenses | ||
| Operating Income | ||
| Non-Operating Income | ||
| EBIT (Earnings Before Interest and Taxes) | ||
| Interest Expense | ||
| Earnings Before Taxes | ||
| Income Tax | ||
| Net Profit Net Income | ||
Financial Ratio Analysis
Financial ratio information can be used to benchmark how a Wine and Distilled Alcoholic Beverage Merchant Wholesalers company compares to its peers. Accounting statistics are calculated from the industry-average for income statements and balance sheets.| Profitability & Valuation Ratios | Industry Average |
|---|---|
| Company valuation can be measured based on the firm's own performance, as well as in comparison against its industry competitors. These metrics show how the average company in the Wine and Distilled Alcoholic Beverage Merchant Wholesalers industry is performing. | |
| Profit Margin Gross Profit Margin, Operating Profit Margin, and Net Profit Margin. Show company earnings relative to revenues. |
|
| Return on Equity (ROE) Return on Equity (ROE) is net income as a percentage of shareholders' equity. Shareholders' Equity is defined as the company's total assets minus total liabilities. ROE shows how much profits a company generates with the money shareholders invested (or with retained earnings). |
|
| Return on Assets (ROA) Return on Assets (ROA) is net income relative to total assets. The market research on Wine and Distilled Alcoholic Beverage Merchant Wholesalers measures how efficiently the company leverages its assets to generate profit. ROA is calculated as Net Income divided by Total Assets. |
|
| Liquidity Ratios | Industry Average |
|---|---|
| Bankers and suppliers use liquidity to determine creditworthiness and identify potential threats to a company's financial viability. | |
| Current Ratio Measures a firm's ability to pay its debts over the next 12 months. |
|
| Quick Ratio (Acid Test) Calculates liquid assets relative to liabilities, excluding inventories. |
|
| Efficiency Ratios - Key Performance Indicators | Industry Average |
|---|---|
| Measure how quickly products and services sell, and effectively collections policies are implemented. | |
| Receivables Turnover Ratio If this number is low in your business when compared to the industry average in the research report, it may mean your payment terms are too lenient or that you are not doing a good enough job on collections. |
|
| Average Collection Period Based on the Receivables Turnover, this estimates the collection period in days. Calculated as 365 divided by the Receivables Turnover |
|
| Inventory Turnover A low turnover rate may point to overstocking, obsolescence, or deficiencies in the product line or marketing effort. |
|
| Fixed-Asset Turnover Generally, higher is better, since it indicates the business has less money tied up in fixed assets for each dollar of sales revenue. |
|
Compensation & Salary Surveys for Employees
Compensation statistics provides an accurate assessment of industry-specific jobs and national salary averages. This information can be used to identify which positions are most common, and high, low, and average annual wages.| Title | Percent of Workforce | Bottom Quartile | Average (Median) Salary | Upper Quartile |
|---|---|---|---|---|
| Management Occupations | 9% | Order at top of page |
||
| Chief Executives | 0% | |||
| General and Operations Managers | 4% | |||
| Business and Financial Operations Occupations | 6% | |||
| Sales and Related Occupations | 18% | |||
| Sales Representatives, Wholesale and Manufacturing | 14% | |||
| Sales Representatives, Wholesale and Manufacturing | 14% | |||
| Sales Representatives, Wholesale and Manufacturing, Except Technical and Scientific Products | 12% | |||
| Office and Administrative Support Occupations | 14% | |||
| Production Occupations | 5% | |||
| Transportation and Material Moving Occupations | 36% | |||
| Motor Vehicle Operators | 15% | |||
| Driver/Sales Workers and Truck Drivers | 15% | |||
| Heavy and Tractor-Trailer Truck Drivers | 8% | |||
| Material Moving Workers | 19% | |||
| Laborers and Material Movers | 17% | |||
| Laborers and Freight, Stock, and Material Movers, Hand | 8% | |||
| Stockers and Order Fillers | 7% | |||
Wine and Distilled Alcoholic Beverage Merchant Wholesalers Competitor Landscape & Key Companies [PREMIUM]
The most influential companies in the Wine and Distilled Alcoholic Beverage Merchant Wholesalers industry and adjacent industries either have large market share or are developing new business models and methods that could disrupt the status quo. We look at leading and emerging companies in the Wine and Distilled Alcoholic Beverage Merchant Wholesalers industry and adjacent sectors:| Market Leaders: Direct Competitors Companies with the largest market share, focused in this industry |
Market leaders: Diversified Competitors Largest companies that have diversified operations in this and other industries |
| Innovators: Direct Competitors Innovative, Emerging, and Disruptive Companies that may influence the future direction of the industry. |
Innovators: Diversified Competitors Innovators and Disruptors in adjacent industries that may also affect the Wine and Distilled Alcoholic Beverage Merchant Wholesalers industry. |
Latest Industry News
- Major wine company will lay off more than 1,700 California workers and leave the state - The country's second-largest alcohol wholesaler is laying off 1,756 employees in California as it prepares to shut down its entire business in the state, according to government filings. Read the original article on sfchronicle.com (07/03/2025)
- Where’s the Corona?: MoCo Alcohol Beverage Services needs to plan better before holidays, store owner says - Montgomery County's Alcohol Beverage Services says supplies will be available Wednesday ahead of holiday weekend. (07/02/2025)
- Provi Welcomes Chief Product and Technology Officer to Drive Digital Growth and Innovation in Beverage Alcohol - Morningstar - Qingqing Ouyang joins Provi’s executive team to scale its product and technology capabilities across the wholesale ecosystem Provi, the largest online B2B marketplace for the beverage alcohol ... (06/23/2025)
- Castello di Amorosa Unveils Libero: A Pioneering Non-Alcoholic Wine Experience - Visitors may opt for a fully non-alcoholic flight or blend Libero with traditional wines for a personalized experience. "This is about more than just wine," says Georg Salzner, President, Castello ... (06/17/2025)
- 10 Types of Vinegar Every Cook Should Know - From crisp distilled white vinegar to sweet-sour balsamic, here are 10 essential vinegar vinegars to know: how they’re made, what they taste like, and when to reach for each. (06/16/2025)
- Beverage giants target 'fourth category' of alcoholic drinks to bring in younger generation - Hard teas, seltzers and ready-to-drink cocktails form a distinct fourth category in beverages, revamping offerings to connect with a younger generation. (06/12/2025)
- Selling wine in N.Y. grocery stores to stall another year - The state's main alcohol distributors have led pushback for years against changes to the state's beverage contol laws, which date back to Prohibition. Distributor Empire Merchant told Skoufis this week that the company has rescinded its opposition to legislation to let restaurants and taverns buy up to six bottles of liquor from a local store when they run out. (06/12/2025)
- VinGardeValise®, The Global Leader in Personal Transportation of All Alcoholic Beverages, Announces Latest Product Innovation In Four Years via their Latest VinAluminum Wine ... - MIAMI, June 12, 2025 /PRNewswire/ -- Today VinGardeValise®, the global leader in the personal transportation of all alcoholic beverages, including wine and spirits, is pleased to announce their ... (06/12/2025)
- Alcohol linked to pancreatic cancer in addition to seven other cancer types | Fox News - Your favorite alcoholic beverage could be linked to deadly form of cancer, study finds Beer and spirits linked to pancreatic cancer in addition to seven other types of the disease (06/11/2025)
- Nonalcoholic Beer Is on Track to Become the Second-Largest Beer Category in the World - Food & Wine - Non-alcoholic beer grew by 9% globally in 2024, even as the total volume of alcoholic beverages declined by 1%. It is projected to surpass ale this year and become the second-largest beer category ... (06/11/2025)


