| Standard Report | Premium Report | |
|---|---|---|
| Current State of the Industry |  |
 |
| Market Size (industry trends) |  |
 |
| Market Forecast (5-year projection) |  |
|
| Products/Services Breakdown |  |
|
| Revenue per State |  |
 |
| Financial Metrics |  |
 |
| Salary & Compensation Statistics |  |
 |
| Public Company Information |  |
 |
| Key Private Companies |  |
|
| Government Vendors |  |
|
| Instant Download - Available immediately upon purchase |  |
 |
Download both PDF and Excel


|
 |
 |
| Download now: |


2026 U.S. Industry Statistics & Market Forecast - International, Secondary Market, and All Other Nondepository Credit Intermediation
Market Size & Industry Statistics
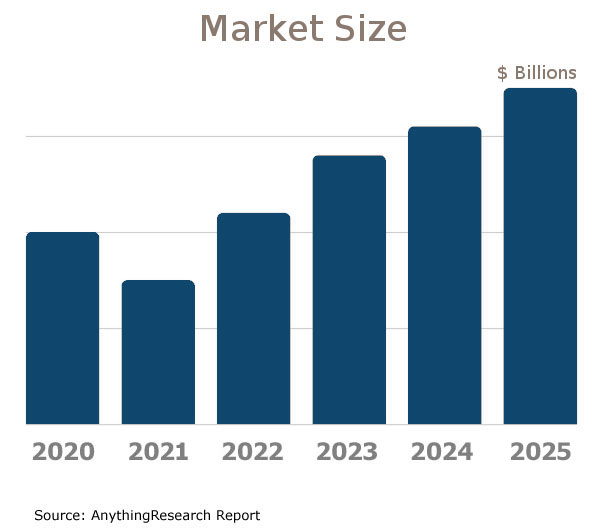
The total U.S. industry market size for International, Secondary Market, and All Other Nondepository Credit Intermediation:
Industry statistics cover all companies in the United States, both public and private, ranging in size from small businesses to market leaders.
In addition to revenue, the industry market analysis shows information on employees, companies, and average firm size.
Investors, banks, and business executives use growth rates and industry trends to understand the market outlook and opportunity.

| Statistics | 2020 2021 2022 2023 2024 2025 | |
|---|---|---|
| Market Size (Total Sales/Revenue) |
Order at top of page | |
| Total Firms | ||
| Total Employees | ||
| Average Revenue Per Firm | ||
| Average Employees Per Firm | ||
| Average Revenue Per Employee | ||
Market Forecast
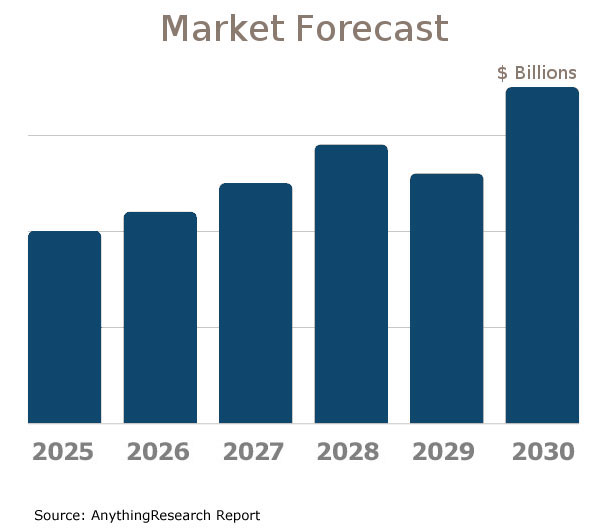
Market forecasts show the long term industry outlook and future growth trends. The following extended five-year forecast projects both short-term and long-term trends.

| Forecast / Industry Outlook | 2025 | 2026 | 2027 | 2028 | 2029 | 2030 |
|---|---|---|---|---|---|---|
| Market Forecast ($ millions) | ||||||
| Projected Industry Growth Rate (%) | ||||||
Product & Services Breakdown
Research products and services in the International, Secondary Market, and All Other Nondepository Credit Intermediation industry generating sales. Note that products are broken into categories with different levels of classification.| Product Description | Number of Companies | Sales ($ millions) | Percent of Total Sales |
|---|---|---|---|
Industry Total |
|||
Loan Services - Income |
|||
Loans To Financial Businesses |
|||
Loans To Non-Financial Businesses |
|||
Factoring Services - Fees |
|||
Other Credit Financing Services - Income |
|||
Financing Related To Securities |
|||
Foreign Currency Exchange Services - Fees |
|||
Other Products Supporting Financial Services - Fees |
|||
U.S. Geographic Distribution: Revenue Statistics by State
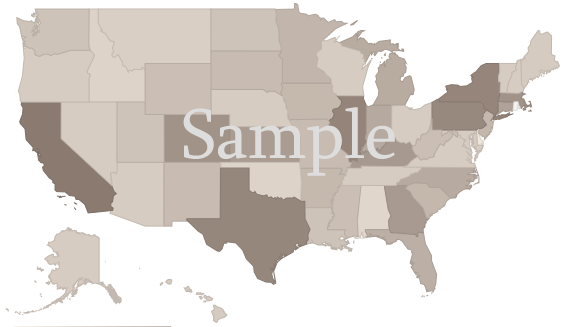
Market Size by State ($ millions) indicates how the industry's competition is distributed throughout the country. State-level information can identify areas with higher and lower industry market share than average.
Income Statement (Average Financial Metrics)
Financial metrics provide a snapshot view of a benchmark "average" company. Key business metrics show revenue and operating costs. The data collected covers both public and private companies.| Industry Average | Percent of Sales (Industry Benchmark) |
|
|---|---|---|
| Total Revenue | Order at top of page |
|
| Operating Revenue | ||
| Cost of Goods Sold | ||
| Gross Profit | ||
Operating Expenses | ||
| Pension, profit sharing plans, stock, annuity | ||
| Repairs | ||
| Rent paid on business property | ||
| Charitable Contributions | ||
| Depletion | ||
| Domestic production activities deduction | ||
| Advertising | ||
| Compensation of officers | ||
| Salaries and wages | ||
| Employee benefit programs | ||
| Taxes and Licenses | ||
| Bad Debts | ||
| Depreciation | ||
| Amortization | ||
| Other Operating Expenses | ||
| Total Operating Expenses | ||
| Operating Income | ||
| Non-Operating Income | ||
| EBIT (Earnings Before Interest and Taxes) | ||
| Interest Expense | ||
| Earnings Before Taxes | ||
| Income Tax | ||
| Net Profit Net Income | ||
Financial Ratio Analysis
Financial ratio information can be used to benchmark how a International, Secondary Market, and All Other Nondepository Credit Intermediation company compares to its peers. Accounting statistics are calculated from the industry-average for income statements and balance sheets.| Profitability & Valuation Ratios | Industry Average |
|---|---|
| Company valuation can be measured based on the firm's own performance, as well as in comparison against its industry competitors. These metrics show how the average company in the International, Secondary Market, and All Other Nondepository Credit Intermediation industry is performing. | |
| Profit Margin Gross Profit Margin, Operating Profit Margin, and Net Profit Margin. Show company earnings relative to revenues. |
|
| Return on Equity (ROE) Return on Equity (ROE) is net income as a percentage of shareholders' equity. Shareholders' Equity is defined as the company's total assets minus total liabilities. ROE shows how much profits a company generates with the money shareholders invested (or with retained earnings). |
|
| Return on Assets (ROA) Return on Assets (ROA) is net income relative to total assets. The market research on International, Secondary Market, and All Other Nondepository Credit Intermediation measures how efficiently the company leverages its assets to generate profit. ROA is calculated as Net Income divided by Total Assets. |
|
| Liquidity Ratios | Industry Average |
|---|---|
| Bankers and suppliers use liquidity to determine creditworthiness and identify potential threats to a company's financial viability. | |
| Current Ratio Measures a firm's ability to pay its debts over the next 12 months. |
|
| Quick Ratio (Acid Test) Calculates liquid assets relative to liabilities, excluding inventories. |
|
| Efficiency Ratios - Key Performance Indicators | Industry Average |
|---|---|
| Measure how quickly products and services sell, and effectively collections policies are implemented. | |
| Receivables Turnover Ratio If this number is low in your business when compared to the industry average in the research report, it may mean your payment terms are too lenient or that you are not doing a good enough job on collections. |
|
| Average Collection Period Based on the Receivables Turnover, this estimates the collection period in days. Calculated as 365 divided by the Receivables Turnover |
|
| Inventory Turnover A low turnover rate may point to overstocking, obsolescence, or deficiencies in the product line or marketing effort. |
|
| Fixed-Asset Turnover Generally, higher is better, since it indicates the business has less money tied up in fixed assets for each dollar of sales revenue. |
|
Compensation & Salary Surveys for Employees
Compensation statistics provides an accurate assessment of industry-specific jobs and national salary averages. This information can be used to identify which positions are most common, and high, low, and average annual wages.| Title | Percent of Workforce | Bottom Quartile | Average (Median) Salary | Upper Quartile |
|---|---|---|---|---|
| Management Occupations | 12% | Order at top of page |
||
| Chief Executives | 0% | |||
| General and Operations Managers | 5% | |||
| Operations Specialties Managers | 6% | |||
| Business and Financial Operations Occupations | 35% | |||
| Business Operations Specialists | 5% | |||
| Financial Specialists | 30% | |||
| Credit Counselors and Loan Officers | 23% | |||
| Loan Officers | 23% | |||
| Sales and Related Occupations | 11% | |||
| Office and Administrative Support Occupations | 36% | |||
| Information and Record Clerks | 24% | |||
| Customer Service Representatives | 6% | |||
| Customer Service Representatives | 6% | |||
| Loan Interviewers and Clerks | 18% | |||
| Loan Interviewers and Clerks | 18% | |||
International, Secondary Market, and All Other Nondepository Credit Intermediation Competitor Landscape & Key Companies [PREMIUM]
The most influential companies in the International, Secondary Market, and All Other Nondepository Credit Intermediation industry and adjacent industries either have large market share or are developing new business models and methods that could disrupt the status quo. We look at leading and emerging companies in the International, Secondary Market, and All Other Nondepository Credit Intermediation industry and adjacent sectors:| Market Leaders: Direct Competitors Companies with the largest market share, focused in this industry |
Market leaders: Diversified Competitors Largest companies that have diversified operations in this and other industries |
| Innovators: Direct Competitors Innovative, Emerging, and Disruptive Companies that may influence the future direction of the industry. |
Innovators: Diversified Competitors Innovators and Disruptors in adjacent industries that may also affect the International, Secondary Market, and All Other Nondepository Credit Intermediation industry. |
Latest Industry News
- Immediate And Future Impacts Of Tariffs On The Private Credit Market - Although the focus is frequently on their effects on public stocks and commodities, the private credit market is just as susceptible, albeit in more subtle ways. Tariffs change how capital is allocated, organized and priced throughout the private lending market, from raising operating costs to changing credit risk evaluations. (07/09/2025)
- Asia credit investors diversify - Overall G3 bond issuance from Asia excluding Japan and Australasia fell to US$197.4bn in 2024 from US$351.3bn in 2019, according to LSEG data, meaning that in some years redemptions have outweighed new issues, sending spreads tighter. (07/09/2025)
- A Leading ‘Quant’ Investor on Value Investing, Private Credit, and Market Risks - Barron's - A Leading ‘Quant’ Investor on Value Investing, Private Credit, and Market Risks Cliff Asness, CIO of AQR Capital Management, is on a winning streak after several years of losses. (07/08/2025)
- Coller Raises $6.8 Billion for Credit Secondary Deals - Liquidity-constrained institutional investors are increasingly looking to offload private-credit holdings. (07/08/2025)
- IMF Executive Board Completes the Fourth Review under the Extended Credit Facility Arrangement with Ghana - The Executive Board of the International Monetary Fund (IMF) today completed the fourth review of the US$3 billion, 36-month Extended Credit Facility (ECF) Arrangement, which was approved by the Board in May 2023. (07/07/2025)
- Trump unveils US 'Gold Card' website: Who can apply, eligibility; all you need to know - International Business News: Donald Trump's \\"Gold Card,\\" offering a path to US citizenship for foreigners investing $5 million, has launched its waiting list. Trump announced the (06/12/2025)
- Backstage Details On AEW's Decision To Unify International And Continental Titles - This week on "AEW Dynamite," it was announced that the AEW International Championship and AEW Continental Championship would be unified at All In Texas. A backstage report has offered more details ... (06/12/2025)
- Oxford Industries, GameStop, Boeing And Other Big Stocks Moving Lower In Thursday's Pre-Market Session - The Boeing Company BA fell 7.4% to $198.10 in pre-market trading. An Air India Boeing 787-8 Dreamliner by Boeing crashed on Thursday near the India's Ahmedabad airport, with 242 passengers on board. (06/12/2025)
- Asia Private Equity Investors Eye 40% Discounts to Lift Returns - Asia’s wealthy investors are eyeing discounts of up to 40% to buy private equity assets in the secondary market as they seek to boost returns, according to asset manager Ardian SAS. (06/10/2025)
- 3 Lessons From International Protests Amid Unrest in L.A. - Images from Los Angeles this week of demonstrators throwing rocks and police officers spraying tear gas mirror scenes of other recent confrontations between protesters and the authorities from ... (06/10/2025)


