| Standard Report | Premium Report | |
|---|---|---|
| Current State of the Industry |  |
 |
| Market Size (industry trends) |  |
 |
| Market Forecast (5-year projection) |  |
|
| Products/Services Breakdown |  |
|
| Revenue per State |  |
 |
| Financial Metrics |  |
 |
| Salary & Compensation Statistics |  |
 |
| Public Company Information |  |
 |
| Key Private Companies |  |
|
| Government Vendors |  |
|
| Instant Download - Available immediately upon purchase |  |
 |
Download both PDF and Excel


|
 |
 |
| Download now: |


2026 U.S. Industry Statistics & Market Forecast - Performing Arts Companies
Market Size & Industry Statistics
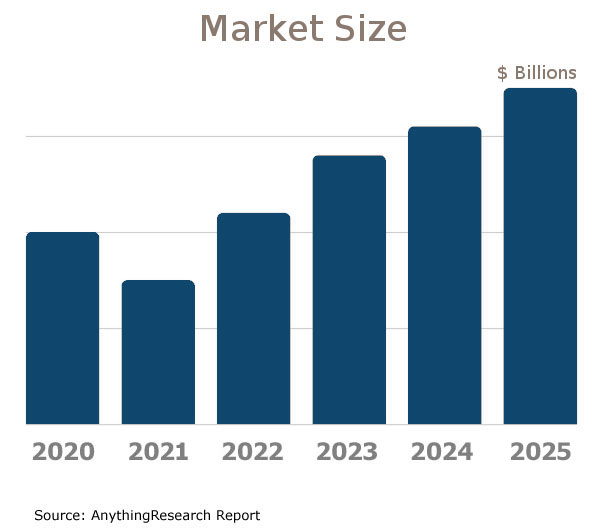
The total U.S. industry market size for Performing Arts Companies:
Industry statistics cover all companies in the United States, both public and private, ranging in size from small businesses to market leaders.
In addition to revenue, the industry market analysis shows information on employees, companies, and average firm size.
Investors, banks, and business executives use growth rates and industry trends to understand the market outlook and opportunity.

| Statistics | 2020 2021 2022 2023 2024 2025 | |
|---|---|---|
| Market Size (Total Sales/Revenue) |
Order at top of page | |
| Total Firms | ||
| Total Employees | ||
| Average Revenue Per Firm | ||
| Average Employees Per Firm | ||
| Average Revenue Per Employee | ||
Market Forecast
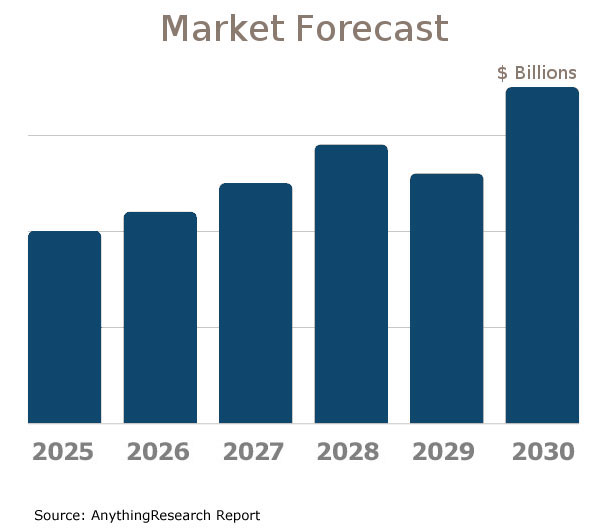
Market forecasts show the long term industry outlook and future growth trends. The following extended five-year forecast projects both short-term and long-term trends.

| Forecast / Industry Outlook | 2025 | 2026 | 2027 | 2028 | 2029 | 2030 |
|---|---|---|---|---|---|---|
| Market Forecast ($ millions) | ||||||
| Projected Industry Growth Rate (%) | ||||||
Industry Insights
Major trends affect the Performing Arts Companies industry include:- Increased digital and online performances due to technology integration and pandemic impacts
- Shift towards diverse and inclusive casting and programming
- Rise in immersive and interactive performance experiences
- Growing emphasis on sustainability in production practices
- Importance of community engagement and local partnerships
- Enhanced focus on mental health and wellbeing of performers and staff
- Increased reliance on hybrid performance models blending live and virtual audiences
- Adoption of dynamic pricing strategies to maximize ticket revenue
- Expansion of educational and outreach programs to build future audiences
- Challenges in securing funding and financial stability amidst economic fluctuations
- Growing competition from digital entertainment options like streaming services
- Adoption of advanced technologies for enhanced stagecraft, such as AR and VR
- Emphasis on niche and experimental works to attract specific audience segments
Product & Services Breakdown
Research products and services in the Performing Arts Companies industry generating sales. Note that products are broken into categories with different levels of classification.| Product Description | Number of Companies | Sales ($ millions) | Percent of Total Sales |
|---|---|---|---|
Industry Total |
|||
Admissions To Live Performing Arts Performances |
|||
Admissions To - Theatrical Performances, Non-Musical |
|||
Admissions To - Musical Theater And Opera Performances |
|||
Admissions To - Symphony And Classical Music Performances |
|||
Admissions To - Popular Music Performances |
|||
Admissions To - Dance Performances, Musical And Non-Musical |
|||
Admissions To - Other Live Performing Arts Performances, Including Fairs And Festivals |
|||
Contract Live Performing Arts Performances |
|||
Contract Live - Theatrical Performances, Non-Musical |
|||
Contract Live - Musical Theater And Opera Performances |
|||
Contract Live - Popular Music Performances |
|||
Contract Live - Other Performing Arts Performances |
|||
Representation Services |
|||
Fine Arts And Theatrical Performance Instruction |
|||
Licensing Of Rights To Use Intellectual Property - Protected By Copyright |
|||
Meals And Beverages, Prepared And Served Or Dispensed, For Immediate Consumption |
|||
Meals And Non-Alcoholicoholic Beverages |
|||
Resale Of Merchandise |
|||
All Other Receipts |
|||
All Other Operating Receipts |
|||
Contributions, Gifts, And Grants - Government |
|||
Contributions, Gifts, And Grants - Government - All Other Federal, State, County, And Municipal |
|||
Contributions, Gifts, And Grants - Private |
|||
Contributions, Gifts, And Grants - Private - Individuals |
|||
Contributions, Gifts, And Grants - Private - Foundations |
|||
Contributions, Gifts, And Grants - Private - Business And Industry |
|||
Contributions, Gifts, And Grants - Private - Other, Including Labor Unions. |
|||
Investment Income, Including Interest And Dividends |
|||
All Other Revenue |
|||
U.S. Geographic Distribution: Revenue Statistics by State
Market Size by State ($ millions) indicates how the industry's competition is distributed throughout the country. State-level information can identify areas with higher and lower industry market share than average.
Income Statement (Average Financial Metrics)
Financial metrics provide a snapshot view of a benchmark "average" company. Key business metrics show revenue and operating costs. The data collected covers both public and private companies.| Industry Average | Percent of Sales (Industry Benchmark) |
|
|---|---|---|
| Total Revenue | Order at top of page |
|
| Operating Revenue | ||
| Cost of Goods Sold | ||
| Gross Profit | ||
Operating Expenses | ||
| Pension, profit sharing plans, stock, annuity | ||
| Repairs | ||
| Rent paid on business property | ||
| Charitable Contributions | ||
| Depletion | ||
| Domestic production activities deduction | ||
| Advertising | ||
| Compensation of officers | ||
| Salaries and wages | ||
| Employee benefit programs | ||
| Taxes and Licenses | ||
| Bad Debts | ||
| Depreciation | ||
| Amortization | ||
| Other Operating Expenses | ||
| Total Operating Expenses | ||
| Operating Income | ||
| Non-Operating Income | ||
| EBIT (Earnings Before Interest and Taxes) | ||
| Interest Expense | ||
| Earnings Before Taxes | ||
| Income Tax | ||
| Net Profit Net Income | ||
Financial Ratio Analysis
Financial ratio information can be used to benchmark how a Performing Arts Companies company compares to its peers. Accounting statistics are calculated from the industry-average for income statements and balance sheets.| Profitability & Valuation Ratios | Industry Average |
|---|---|
| Company valuation can be measured based on the firm's own performance, as well as in comparison against its industry competitors. These metrics show how the average company in the Performing Arts Companies industry is performing. | |
| Profit Margin Gross Profit Margin, Operating Profit Margin, and Net Profit Margin. Show company earnings relative to revenues. |
|
| Return on Equity (ROE) Return on Equity (ROE) is net income as a percentage of shareholders' equity. Shareholders' Equity is defined as the company's total assets minus total liabilities. ROE shows how much profits a company generates with the money shareholders invested (or with retained earnings). |
|
| Return on Assets (ROA) Return on Assets (ROA) is net income relative to total assets. The market research on Performing Arts Companies measures how efficiently the company leverages its assets to generate profit. ROA is calculated as Net Income divided by Total Assets. |
|
| Liquidity Ratios | Industry Average |
|---|---|
| Bankers and suppliers use liquidity to determine creditworthiness and identify potential threats to a company's financial viability. | |
| Current Ratio Measures a firm's ability to pay its debts over the next 12 months. |
|
| Quick Ratio (Acid Test) Calculates liquid assets relative to liabilities, excluding inventories. |
|
| Efficiency Ratios - Key Performance Indicators | Industry Average |
|---|---|
| Measure how quickly products and services sell, and effectively collections policies are implemented. | |
| Receivables Turnover Ratio If this number is low in your business when compared to the industry average in the research report, it may mean your payment terms are too lenient or that you are not doing a good enough job on collections. |
|
| Average Collection Period Based on the Receivables Turnover, this estimates the collection period in days. Calculated as 365 divided by the Receivables Turnover |
|
| Inventory Turnover A low turnover rate may point to overstocking, obsolescence, or deficiencies in the product line or marketing effort. |
|
| Fixed-Asset Turnover Generally, higher is better, since it indicates the business has less money tied up in fixed assets for each dollar of sales revenue. |
|
Compensation & Salary Surveys for Employees
Compensation statistics provides an accurate assessment of industry-specific jobs and national salary averages. This information can be used to identify which positions are most common, and high, low, and average annual wages.| Title | Percent of Workforce | Bottom Quartile | Average (Median) Salary | Upper Quartile |
|---|---|---|---|---|
| Management Occupations | 9% | Order at top of page |
||
| Top Executives | 6% | |||
| Chief Executives | 0% | |||
| General and Operations Managers | 5% | |||
| General and Operations Managers | 5% | |||
| Business and Financial Operations Occupations | 10% | |||
| Business Operations Specialists | 9% | |||
| Educational Instruction and Library Occupations | 8% | |||
| Other Teachers and Instructors | 8% | |||
| Self-Enrichment Teachers | 8% | |||
| Self-Enrichment Teachers | 8% | |||
| Arts, Design, Entertainment, Sports, and Media Occupations | 39% | |||
| Entertainers and Performers, Sports and Related Workers | 31% | |||
| Actors, Producers, and Directors | 9% | |||
| Actors | 6% | |||
| Producers and Directors | 6% | |||
| Musicians, Singers, and Related Workers | 17% | |||
| Musicians and Singers | 14% | |||
| Food Preparation and Serving Related Occupations | 6% | |||
| Food and Beverage Serving Workers | 7% | |||
| Personal Care and Service Occupations | 7% | |||
| Entertainment Attendants and Related Workers | 5% | |||
| Ushers, Lobby Attendants, and Ticket Takers | 5% | |||
| Ushers, Lobby Attendants, and Ticket Takers | 5% | |||
| Office and Administrative Support Occupations | 8% | |||
Performing Arts Companies Competitor Landscape & Key Companies [PREMIUM]
The most influential companies in the Performing Arts Companies industry and adjacent industries either have large market share or are developing new business models and methods that could disrupt the status quo. We look at leading and emerging companies in the Performing Arts Companies industry and adjacent sectors:| Market Leaders: Direct Competitors Companies with the largest market share, focused in this industry |
Market leaders: Diversified Competitors Largest companies that have diversified operations in this and other industries |
| Innovators: Direct Competitors Innovative, Emerging, and Disruptive Companies that may influence the future direction of the industry. |
Innovators: Diversified Competitors Innovators and Disruptors in adjacent industries that may also affect the Performing Arts Companies industry. |
Latest Industry News
- Steel and concrete rise at University of Alabama's new performing arts center - The $50 million Smith Center for the Performing Arts will include venues specifically designed for drama and dance. (07/07/2025)
- Theatre review: The 7 Stages of Grieving, Subiaco Arts Centre - Directed by Bobbi Henry, Yirra Yaakin Theatre Company’s staging of Wesley Enoch and Deborah Mailman’s one-woman play The 7 Stages of Grieving begins with soft murmurings of grief, which build into tides of emotion. (07/07/2025)
- 'Wicked' and other music and theater performances to see in Milwaukee in July 2025 - Here are three promising performing arts shows scheduled for July 2025, including a long run of the musical "Wicked." (06/29/2025)
- More performing arts groups move to Tanjong Pagar Distripark, expanding arts cluster - Landlord Mapletree has doubled the number of arts tenants at Tanjong Pagar Distripark from seven in 2022 to 16 in 2025. Read more at straitstimes.com. Read more at straitstimes.com. (06/26/2025)
- Arts groups boost offerings as NAC expands arts education programme to all preschools by 2027 - SINGAPORE: The National Arts Council (NAC) plans to expand its Arts Education Programme (AEP) to include all preschools by 2027. The AEP currently serves more than 500 government-assisted preschools. It offers about 1,400 programmes led by 300 artists and arts groups, supported by about 2,000 registered arts educators. (06/26/2025)
- Global Arts Festival Taking Shape Inside Gowanus Power Station - International will feature works from South Africa’s William Kentridge, Brazil’s Carolina Bianchi — and 10,000, $30 tickets. (06/25/2025)
- New performing arts academy launched by Star Academies - The Valley Leadership Academy, Bacup and Rawtenstall Grammar School are taking part in The Star Performing Arts Academy (06/25/2025)
- New Jersey Ballet 2025/2026 Season at Mayo Performing Arts Center - New Jersey Ballet has announced its 2025/2026 Season at Mayo Performing Arts Center (MPAC), where the company serves as the Resident Ballet Company. This season offers an inspiring mix of bold contemporary choreography, (06/24/2025)
- Arts at the Heart: Performing Arts Academy promotes access and opportunity at Star schools - Following a successful pilot programme, Star Academies has launched the Star Performing Arts Academy in five of its North-West schools — working together to broaden access to creative opportunities and put the arts at the heart of school life. (06/23/2025)
- ANNIE, STEEL MAGNOLIAS Included in Franklin Performing Arts Company 2025-26 Season - The exciting lineup will include Annie, Peter and the Starcatcher, Steel Magnolias, Into the Woods, and Once. Additionally, FPAC Holiday Productions will present holiday favorites The Nutcracker and Humbug! (06/21/2025)


